Parkland County Acreage Market Overview: February 2026
2026 as the rural real estate sector adjusted to changing inventory levels and pricing trends. While the number of sales slowed compared to the same time last year, sellers are still entering the market with strong pricing expectations, and properties that are priced appropriately continue to attract buyers.
If you are thinking about buying or selling an acreage in Parkland County, understanding the latest market data can help you make informed decisions as we move into the busy spring real estate season.
📞 Have questions about your acreage or the current market? Call Chris Reid at (780) 717-5267.
February 2026 Market Snapshot
According to the February 2026 Parkland County Local Market Update
10 acreages sold in February 2026
32 new listings entered the market
Average asking price: $1.12M
Average sale price: $676K
Days on market: 72 days
Ask-to-sell ratio: 0.975
These numbers highlight a slower start to the year for acreage sales, but also demonstrate that the rural market remains active with new inventory entering ahead of the spring season.
Below Graphs Are Interactive
Parkland County Acreage Listings
Inventory Levels: New Listings Decline
Parkland County saw 32 new acreage listings in February, representing a 36% drop compared to the same month last year
On a year-to-date basis:
63 new listings in 2026
87 new listings in 2025
This represents a 27.59% decrease in new listings.
Lower inventory can eventually create stronger competition among buyers, particularly once spring arrives and demand increases. Sellers considering listing their acreage may benefit from entering the market before inventory rises later in the year.
Average List Price
Average Asking Prices Continue to Climb
One of the most notable statistics in February was the increase in the average asking price. Acreage sellers listed properties at an average of $1.12 million, representing a 30.03% increase compared to February 2025.
Year-to-date, the average asking price sits at $1.07M, up 23.36% compared to $865K in early 2025.
This rise suggests sellers remain confident in the long-term value of rural real estate in Parkland County. Acreages offering modern homes, large shops, or proximity to Edmonton commuter routes are particularly desirable and often command premium prices.
Parkland County Acreage Sales
Acreage Sales Slow Compared to Last Year
There were 10 properties sold in February, representing a 62.96% decrease from February 2025
. On a year-to-date basis, Parkland County recorded 27 sales in 2026 compared to 42 during the same period in 2025, a 35.71% decline.
This decrease in sales activity can often occur during winter months when fewer buyers are actively searching for rural properties. Many acreage buyers prefer to view properties once the snow melts, allowing them to better assess the land, landscaping, and outbuildings.
However, the slower sales pace also creates opportunities for buyers who are actively searching now, as competition is typically lower in the winter months.
Parkland County Average Sale Price
Average Sale Price Adjusts From Last Year
While asking prices increased, the average sale price in February came in at $676K, a 19.30% decrease from February 2025
Year-to-date, the average sale price is $709K, compared to $842K during the same period in 2025, reflecting a 15.77% decline.
This shift does not necessarily indicate a weakening market. Instead, it likely reflects differences in the types of properties sold during each period. A few high-end acreage sales in early 2025 significantly boosted last year’s averages, which can make year-over-year comparisons appear dramatic.
Buyers Still Paying Close to Asking Price
The average ask-to-sell ratio in February was 0.975, meaning properties sold for about 97.5% of the asking price
Year-to-date, the ratio sits at 0.985, slightly higher than 0.976 during the same period last year.
This indicates that properly priced acreages continue to attract strong offers, even in a slower winter market.
Average Days on MLS®
Days on Market Improve for February Sales
The average days on market in February was 72 days, which is 11.11% faster than February 2025
However, when looking at year-to-date numbers, properties are taking slightly longer to sell:
109 days on market in 2026
97 days in 2025
This represents a 12.37% increase.
Acreage properties often require longer marketing periods than city homes because buyers are evaluating additional factors such as land use, zoning, septic systems, water supply, and distance from services.
What This Means for Buyers
For acreage buyers, February can be an excellent time to explore the market. With fewer competing buyers and more negotiating flexibility, buyers may have opportunities that are harder to find during the spring rush.
Key advantages for buyers right now include:
Less competition compared to peak seasons
Motivated sellers who listed during winter
Time to perform due diligence before the busy spring market
What This Means for Sellers
For sellers considering listing an acreage in Parkland County, current conditions suggest a strategic opportunity heading into spring.
While winter sales were slower, inventory is also down significantly. This means well-priced properties can stand out in the market.
Preparing your property now—whether through staging, repairs, or professional marketing—can help position your acreage to attract buyers once the spring market accelerates.
Year-to-Date Comparison Chart
Metric
2026 YTD
2025 YTD
% Change
Sold Properties
27
42
↓ 35.71%
New Listings
63
87
↓ 27.59%
Average Asking Price
$1.07M
$865K
↑ 23.36%
Average Sale Price
$709K
$842K
↓ 15.77%
Days on Market
109
97
↑ 12.37%
Ask-to-Sell Ratio
0.985
0.976
↑ 0.89%
(Source: February 2026 Parkland County Local Market Update
parkland
)
Final Thoughts on the Parkland County Acreage Market
The February 2026 data shows a market that is transitioning toward the spring real estate season. Sales activity was lower than last year, but strong asking prices and steady buyer interest suggest that the acreage market remains stable.
With fewer listings entering the market and spring demand approaching, both buyers and sellers should keep a close eye on Parkland County real estate trends over the next few months.
If you're considering buying or selling an acreage in Parkland County this year, working with a local expert who understands rural property values can make a significant difference.
Contact Chris Reid – Parkland County Acreage Specialist
If you would like to learn more about the Parkland County acreage market or get an updated valuation for your property:
Chris Reid
Century 21 Leading
📞 (780) 717-5267
📧 creid@chrisreidedmonton.com
Let’s turn your real estate goals into reality. I specialize in Parkland County acreages, and I would be honoured to be your trusted guide in this beautiful rural community.
Data provided by the REALTORS® Association of Edmonton and subject to change. Always consult with a real estate professional for the most current market information.
If you would like more information on buying and selling in Parkland County CONTACT CHRIS REID
Edmonton Real Estate Market Update – February 2026
The Edmonton real estate market continued to evolve in February 2026, showing a mix of rising prices, increasing inventory, and slower transaction timelines compared to last year. While sales volume remains lower than the same period in 2025, price growth and listing activity signal that the market is transitioning toward a more balanced environment.
For buyers and sellers across the Greater Edmonton Area, understanding these trends is essential as we move closer to the spring market — historically the busiest time of year for real estate.
Below is a full breakdown of what happened in February and what it means for the Edmonton housing market moving forward.
Edmonton Housing Market Snapshot – February 2026
Here are the key residential real estate statistics for Edmonton in February 2026:
Sold Properties: 1,120 homes
Average Asking Price: $485,000
Average Sale Price: $444,000
New Listings: 2,250 homes
Days on Market: 80 days
Ask-to-Sell Ratio: 0.978
While sales activity declined slightly year-over-year, prices continued to climb and new inventory increased significantly.
Below Graphs Are Interactive.
Edmonton New MLS® Listings
New Listings Surge as Spring Market Approaches
February saw a significant increase in inventory, with 2,250 new listings entering the Edmonton market.
That represents an 11.83% increase compared to February 2025.
More inventory is a typical pattern as winter ends and sellers prepare to take advantage of spring demand.
This increase in listings creates:
More choice for buyers
More competition for sellers
More balanced negotiation conditions overall
The rising supply may also help moderate price growth later in the year, particularly if sales activity remains steady rather than accelerating dramatically.
Average List Price Edmonton Real Estate Market
Average Asking Price Reflects Seller Confidence
The average list price in February reached $485,000, a 1.61% increase year-over-year. This modest increase reflects growing seller confidence, especially as the spring market approaches.
Typically, homeowners preparing to sell in spring begin listing their properties between February and April. As a result, we often see asking prices gradually climb during this period.
However, pricing accuracy remains extremely important.
Homes priced correctly continue to sell quickly, while properties listed above market value tend to stay on the market longer.
Home Sales In The Edmonton Real Estate Market
Home Sales in Edmonton – February 2026
A total of 1,120 residential properties sold in Edmonton during February 2026, representing an 11.51% decrease compared to February 2025. While this drop may seem significant at first glance, it’s important to understand the broader context.
The early months of 2025 experienced unusually strong sales activity as buyers rushed into the market ahead of expected interest rate adjustments. That surge created a higher benchmark for comparison this year.
What we’re seeing in 2026 is not necessarily a weakening market, but rather a normalization of activity levels.
Buyers are still active, but they are:
Taking more time to evaluate properties
Negotiating more frequently
Waiting for the right home rather than rushing to compete
This shift often happens when markets transition from intense seller conditions toward more balanced dynamics.
Edmonton Average Home Sale Price
Average Sale Price Continues to Rise
Despite lower transaction volume, the average sale price climbed to $444,000 in February 2026, representing a 4.83% increase compared to February 2025. This continued price growth is one of the most important signals in the Edmonton market.
It indicates that:
Demand remains healthy
Sellers are still achieving strong values
Edmonton housing continues appreciating steadily
Unlike some larger Canadian markets that have experienced volatile price swings, Edmonton has maintained a reputation for consistent, moderate growth.
For homeowners, this is excellent news.
For buyers, it reinforces the importance of entering the market sooner rather than later if long-term appreciation continues.
Ask-to-Sell Ratio Shows More Negotiation
The average ask-to-sell ratio for February was 0.978, down slightly from the previous year.
This means homes sold for about 97.8% of their list price on average.
This small change suggests that:
Buyers are negotiating slightly more
Sellers must price homes accurately
Overpriced homes may require price adjustments
Again, this reflects a market moving toward balance rather than a sharp correction.
Edmonton Real Estate Market -Average Days
Days on Market Increasing
One of the biggest changes in the February report was the increase in the average days on market, which rose to 80 days.
This represents a 45.45% increase compared to February 2025.
Longer selling times often reflect a market that is shifting away from the extremely competitive conditions seen in previous years.
Several factors can contribute to longer selling timelines:
More available inventory
Buyers taking longer to make decisions
Increased negotiation between buyers and sellers
However, this does not mean homes are not selling.
Rather, it means buyers have slightly more time to evaluate options, which is a healthier environment overall.
Year-to-Date Edmonton Market Comparison
Below is the year-to-date comparison for January and February combined.
Metric
2026 YTD
2025 YTD
% Change
Sold Properties
1,930
2,460
↓ 21.65%
Average Asking Price
$483,000
$480,000
↑ 0.50%
Average Sale Price
$438,000
$424,000
↑ 3.31%
New Listings
4,120
3,830
↑ 7.62%
Days on Market
85
63
↑ 34.92%
Ask-to-Sell Ratio
0.975
0.990
↓ 1.49%
These numbers highlight an important shift in the Edmonton market.
Sales volume is down, but prices and listings are rising.
This combination suggests the market is stabilizing rather than weakening.
What This Means for Buyers in Edmonton
If you are planning to buy a home in Edmonton in 2026, current conditions may offer some advantages.
Buyers now have:
More listings to choose from
Slightly longer decision timelines
More negotiation opportunities
However, prices are still trending upward.
This means waiting too long could result in paying more later, particularly if spring demand strengthens as expected.
What This Means for Sellers
For homeowners considering selling, the February report reinforces the importance of preparation and pricing.
Successful sellers in today’s market are:
Pricing competitively
Preparing homes properly for market
Marketing properties professionally
While homes may take slightly longer to sell compared to previous years, strong pricing and presentation can still produce excellent results.
Edmonton Real Estate Outlook for Spring 2026
Looking ahead, the Edmonton market is expected to become more active as we move into the spring buying season.
Several factors could influence the market:
Population growth and migration into Alberta
Interest rate changes later in 2026
Strong employment levels in the province
Continued affordability compared to other major Canadian cities
If these trends continue, Edmonton may see increased demand through the spring and summer months.
Thinking About Buying or Selling in Edmonton?
Whether you're purchasing your first home, upgrading, downsizing, or investing in Edmonton real estate, having the right strategy is key.
If you'd like to talk about the current market, get an accurate home value, or explore available listings, I’d be happy to help.
📞 Chris Reid – REALTOR®
Century 21 Leading
Phone: (780) 717-5267
Email: creid@chrisreidedmonton.com
Let’s make your next move the right one!
Data provided by the REALTORS® Association of Edmonton and subject to change. Always consult with a real estate professional for the most current market information.
Spruce Grove Real Estate Market Update February 2026
The Spruce Grove real estate market continued to show signs of a more balanced market as we moved through February 2026. While sales activity remained lower than the same time last year, pricing held relatively steady and inventory levels stayed consistent. These trends suggest that buyers and sellers alike are adjusting to current market conditions as we approach the busy spring real estate season.
If you’re considering buying or selling in Spruce Grove this year, understanding the latest numbers can help you make informed decisions.
📊 February 2026 Market Snapshot
According to the February 2026 Spruce Grove Local Market Update, the key statistics for the month include:
69 homes sold in February
123 new listings came onto the market
Average sale price: $477,000
Average asking price: $494,000
Days on market: 82 days
Ask-to-sell ratio: 0.991
Year-to-date statistics for the first two months of the year show:
124 total homes sold
239 new listings
Average sale price YTD: $484,000
Average asking price YTD: $507,000
Average days on market: 82 days
These numbers provide a helpful snapshot of how the Spruce Grove housing market is performing so far in 2026.
The below graphs are interactive
New MLS® Listing Count
📦 New Listings: Inventory Holding Steady
February saw 123 new listings enter the Spruce Grove market, only a 1.60% decrease compared to February 2025
Year-to-date, 239 homes have been listed, slightly lower than the 244 listings recorded during the same time last year.
This relatively stable inventory level means buyers continue to have a reasonable selection of homes to choose from. Unlike the extremely tight inventory conditions seen in previous years, today’s market allows buyers to evaluate options more carefully before making an offer.
For sellers, this means that pricing and presentation remain key factors in attracting buyers and reducing time on market.
Average Listing Price in Spruce Grove
💰 Average Asking Price: Slight Increase Month-to-Month
The average asking price in February 2026 was $494,000, representing a 2.54% increase from February 2025
However, when we look at the year-to-date numbers, the average asking price sits at $507,000, which is 1.92% lower than the same period in 2025.
This indicates that while individual listings may be priced higher month-to-month, overall seller expectations have moderated slightly compared to last year.
Pricing accurately from the beginning continues to be one of the most important strategies for sellers in today’s market.
Spruce Grove Home Sales
🏠 Sales Activity: Slight Slowdown Compared to Last Year
In February 2026, 69 homes sold, representing a 12.66% decrease compared to February 2025
Looking at the year-to-date figures, 124 homes have sold so far in 2026, compared to 146 during the same period last year — a 15.07% decline.
This reduction in sales volume reflects a market where buyers are taking more time to make decisions. Factors such as interest rates, affordability, and increased inventory are all contributing to slightly slower transaction activity compared to early 2025.
However, lower sales volume does not necessarily mean a weak market. Instead, it suggests a shift toward a more balanced environment, where buyers have more options and sellers need to price homes competitively.
Real Estate Market Statistics Spruce Grove Average Home Sale Price
📈 Average Sale Price: Holding Strong Despite Market Shift
The average sale price for February 2026 was $477,000, which is 3.05% lower than February 2025
However, the year-to-date average sale price of $484,000 is actually 1.38% higher than last year.
This is an important takeaway.
Although monthly fluctuations occur, the overall trend shows that home values in Spruce Grove remain resilient. Well-priced homes that are properly marketed continue to attract buyers and achieve solid sale prices.
⚖️ Ask-to-Sell Ratio: Negotiation Returning to the Market
The average ask-to-sell ratio in February was 0.991, meaning homes sold for about 99.1% of their list price on average
.
This is a 1.20% decline compared to February 2025, indicating slightly more room for negotiation between buyers and sellers.
Year-to-date, the ratio sits at 0.987 compared to 1.001 last year, further supporting the trend toward a more balanced market where buyers may have more leverage during negotiations.
Days on Market Until Sale
⏳ Days on Market: Homes Taking Longer to Sell
Homes in Spruce Grove took 82 days on average to sell in February, representing a 10.81% increase compared to February 2025
Looking at year-to-date data, the average days on market has increased significantly compared to last year, rising from 68 days to 82 days — a 20.59% increase.
This longer selling timeline reflects a market where buyers are more cautious and deliberate.
For sellers, this reinforces the importance of:
competitive pricing
strong marketing
preparing the home to show at its best
📊 YTD Comparison: 2026 vs 2025
Metric
2026 YTD
2025 YTD
% Change
Sold Properties
124
146
↓ 15.07%
Average Asking Price
$507,000
$517,000
↓ 1.92%
Average Sale Price
$484,000
$477,000
↑ 1.38%
New Listings
239
244
↓ 2.05%
Days on Market
82
68
↑ 20.59%
Ask-to-Sell Ratio
0.987
1.001
↓ 1.42%
🏡 What This Means for Buyers
For buyers, the Spruce Grove market currently offers several advantages:
✔ More time to view properties
✔ Less pressure from bidding wars
✔ Increased negotiating flexibility
✔ Stable home values
With spring approaching, buyer activity is expected to increase. Getting pre-approved and starting your search early can give you a competitive advantage.
If you're considering purchasing a home in Spruce Grove this year, I'd be happy to help guide you through the process.
📞 Call or text Christina Reid at (780) 717-5267
💡 What This Means for Sellers
For sellers, the key to success in this market is strategic positioning.
Homes that sell quickly and for the best price typically share a few common factors:
accurate pricing based on current market data
strong online marketing and photography
well-prepared and staged interiors
flexibility during negotiations
While homes may take longer to sell than they did in previous years, properly prepared properties are still achieving strong results.
🌇 Why Buyers Continue to Choose Spruce Grove
Spruce Grove remains one of the most attractive communities in the Edmonton region thanks to its:
family-friendly neighbourhoods
strong local schools
parks and recreation amenities
easy access to Edmonton via Highway 16
modern housing developments
Neighbourhoods such as Prescott, Fenwyck, Greenbury, Harvest Ridge, and McLaughlin continue to be popular choices for families and professionals alike.
📞 Thinking About Buying or Selling in Spruce Grove?
Real estate markets are constantly evolving, and having local expertise on your side can make all the difference.
Whether you're planning to buy your first home, upgrade, downsize, or invest, I’m here to help you navigate the Spruce Grove market with confidence.
📱 Christina Reid – REALTOR®
📞 (780) 717-5267
🌐 chrisreidedmonton.com
Data provided by the REALTORS® Association of Edmonton and subject to change. Always consult with a real estate professional for the most current market information.
Stony Plain Real Estate Market Update: February 2026
The Stony Plain real estate market continued its winter pattern in February 2026, with moderate sales activity, steady inventory growth, and shifting pricing trends. While the number of homes sold declined compared to last year, the year-to-date data shows that home values remain strong overall, reinforcing Stony Plain’s reputation as a stable and desirable housing market in the Edmonton region.
February’s numbers provide valuable insight into how the market is positioning itself ahead of the busy spring real estate season. With more listings entering the market and buyers beginning to re-emerge after the winter slowdown, this month offers a preview of what we may expect as we move deeper into 2026.
February 2026 Market Snapshot
Metric
February 2026
February 2025
% Change
Sold Properties
27
32
-15.63%
YTD Sold Properties
48
69
-30.43%
Average Asking Price
$454,000
$406,000
+11.68%
YTD Average Asking Price
$455,000
$428,000
+6.37%
New Listings
50
47
+6.38%
YTD New Listings
86
91
-5.49%
Average Days on Market
57
57
0.00%
YTD Days on Market
76
57
+33.33%
Average Sale Price
$388,000
$429,000
-9.57%
YTD Average Sale Price
$403,000
$378,000
+6.68%
Ask-to-Sell Ratio
97.7%
100.4%
-2.69%
YTD Ask-to-Sell Ratio
98.3%
99.3%
-1.05%
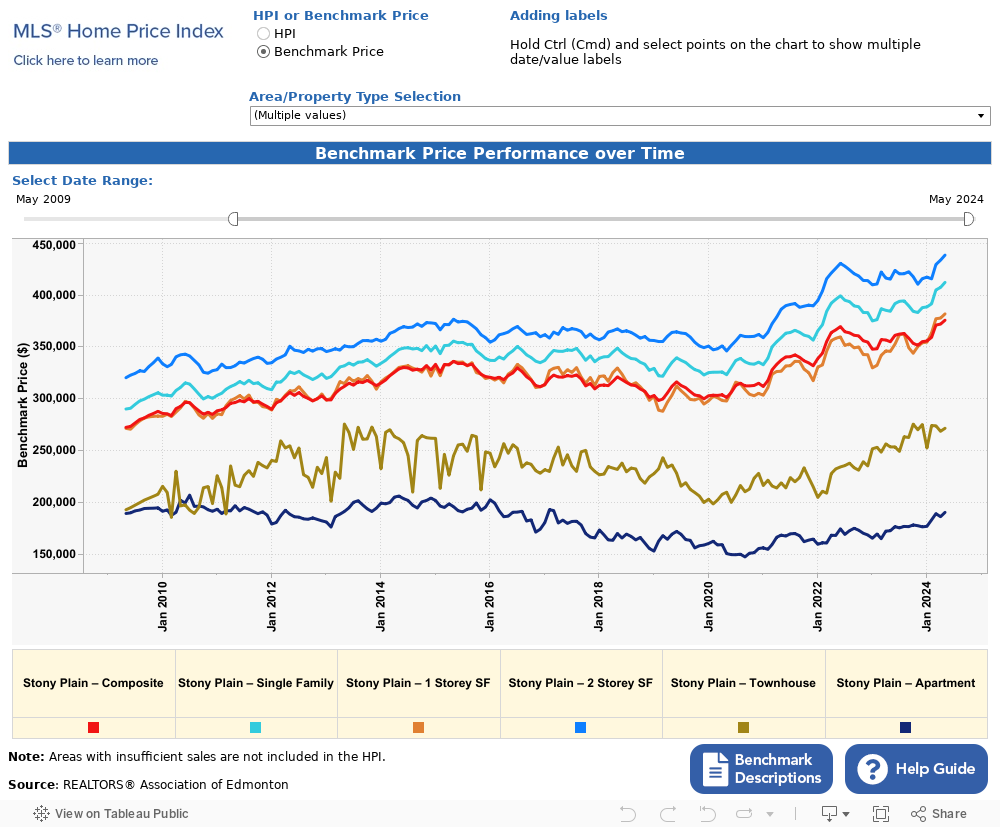
Market Overview: February Trends in Stony Plain
February delivered a mix of signals for the local housing market. While sales activity dipped compared to last year, the market continues to demonstrate resilience through strong asking prices and healthy year-to-date price growth.
The February report indicates that buyer activity is gradually returning, though not yet at the pace seen during the early months of 2025.
New construction activity in Stony Plain during February remained solid, with 10 new construction homes sold. These properties had an average list price of $575,912 and ultimately sold for an average of $569,025, showing that builders were achieving close to their asking prices. Prices ranged from $390,000 to $799,900, with a median sale price of $516,000, highlighting the wide variety of new build options available in the market. Homes spent an average of 44 days on market, with a range from 25 to 115 days, indicating that well-priced new builds continue to attract buyers relatively quickly. Overall, new construction generated $5,690,250 in total sales volume, demonstrating continued buyer interest in modern homes and newly developed communities in Stony Plain.
Below Graphs Are Interactive
Stony Plain Real Estate - New MLS® Listings
New Listings Begin to Increase
February saw 50 new listings enter the Stony Plain market, representing a 6.38% increase compared to last year. However, year-to-date listings are still slightly lower overall:
86 new listings in 2026
91 new listings in 2025
This small decline indicates that inventory remains relatively tight, which may continue supporting property values as buyer activity increases in the coming months.
More listings typically begin appearing in March and April as the spring market ramps up.
Average Asking Price of Homes in Stony Plain
Average Asking Price Shows Strong Growth
The average asking price in February reached $454,000, representing an 11.68% increase compared to February 2025.
On a year-to-date basis, the average asking price sits at $455,000, up 6.37% from the same period last year.
This increase in list prices reflects continued seller confidence in the Stony Plain market. Homeowners appear optimistic about property values heading into the 2026 spring market.
Stony Plain Home Sales
Home Sales Decline Compared to Last Year
A total of 27 homes sold in February 2026, representing a 15.63% decrease from February 2025.
Looking at the broader picture, 48 homes have sold year-to-date, compared to 69 at the same point in 2025, a 30.43% decline.
While this may seem significant, it’s important to note that the early months of the year typically have fewer transactions as buyers wait for more inventory to appear in spring.
Lower sales early in the year often reflect seasonal market cycles rather than long-term shifts in demand.
Stony Plain Real Estate Market- Average Home Sale Price
Average Sale Price Dips in February
The average sale price in February 2026 was $388,000, representing a 9.57% decrease compared to February 2025.
However, the year-to-date average sale price tells a more encouraging story:
$403,000 in 2026
$378,000 in 2025
That represents a 6.68% increase year-over-year, confirming that overall property values in Stony Plain continue to trend upward despite short-term monthly fluctuations.
Monthly changes in average sale price are often influenced by the type and price range of homes sold during that specific month.
Ask-to-Sell Ratio Indicates Slightly Softer Negotiations
The average ask-to-sell ratio in February was 97.7%, meaning homes sold for slightly below asking price on average.
Year-to-date, the ratio sits at 98.3%, slightly below last year’s 99.3%.
This suggests that buyers currently have a bit more negotiating power compared to the competitive conditions seen earlier in 2025.
Stony Plain Average Days on Market
Days on Market Holds Steady for February
Homes in Stony Plain took an average of 57 days to sell in February, which is unchanged from February 2025.
However, year-to-date figures show a noticeable difference:
76 days on market in 2026
57 days in 2025
This represents a 33.33% increase in the time it takes homes to sell so far this year.
This shift may reflect buyers taking more time to evaluate properties, as well as the smaller number of active buyers during winter months.
What This Means for Buyers
For buyers considering entering the Stony Plain market, February offers several advantages:
More inventory is beginning to appear
As new listings increase, buyers have more options to choose from.
Less competition than the spring market
The slower winter pace means fewer bidding wars and more room for negotiation.
Stable long-term price growth
Despite a monthly dip in sale price, the year-to-date numbers show strong appreciation.
Opportunity before spring demand increases
Historically, March and April bring a surge in activity. Buyers who act early may benefit from better selection and pricing.
What This Means for Sellers
Sellers also have opportunities in the current market:
Strong asking price growth
Homes are entering the market at higher list prices than last year.
Limited inventory still supports values
Even with increased listings in February, overall supply remains tight.
Preparation for spring is key
Sellers considering listing should begin preparing now to take advantage of the upcoming spring market.
Pricing strategy matters
With buyers negotiating slightly more, accurate pricing is critical to attract strong offers quickly.
Why Stony Plain Continues to Attract Buyers
Stony Plain remains one of the most appealing communities in the Edmonton region thanks to its combination of affordability, location, and lifestyle.
Homebuyers are drawn to Stony Plain for its:
Proximity to Edmonton and Spruce Grove
Family-friendly neighbourhoods
Growing local amenities and services
Strong long-term property value growth
For many buyers seeking more space while remaining close to the city, Stony Plain offers the perfect balance of small-town charm and urban accessibility.
Looking Ahead to the Spring 2026 Market
As we move closer to spring, the Stony Plain real estate market is expected to experience increased activity.
Key trends to watch include:
Rising inventory levels as more sellers list homes in preparation for spring.
Increased buyer demand as warmer weather and improved selection attract more house hunters.
Continued price stability supported by strong demand and limited housing supply.
Overall, February’s numbers suggest that the Stony Plain market is preparing for a busy spring season, even if early-year sales remain slower than last year.
Year-to-Date Market Comparison (2026 vs 2025)
Metric
2026 YTD
2025 YTD
% Change
Sold Properties
48
69
-30.43%
Average Asking Price
$455,000
$428,000
+6.37%
New Listings
86
91
-5.49%
Average Days on Market
76 days
57 days
+33.33%
Average Sale Price
$403,000
$378,000
+6.68%
Ask-to-Sell Ratio
98.3%
99.3%
-1.05%
Thinking About Buying or Selling in Stony Plain?
If you're planning to buy or sell in Stony Plain, Spruce Grove, or the greater Edmonton region, understanding current market trends can make all the difference.
I'm Chris Reid, REALTOR® with Century 21 Leading, and I specialize in helping buyers and sellers navigate the local market with confidence.
Data provided by the REALTORS® Association of Edmonton and subject to change. Always consult with a real estate professional for the most current market information.
If you are considering buying or selling a home in Stony Plain or just want more information on the Stony Plain real estate market, CONTACT ME HERE.
The Leduc real estate market continued to evolve in February 2026 as inventory increased and buyers gained more selection across the market. While home sales dipped compared to last year, prices remain stable and the overall value of homes in Leduc continues to trend upward on a year-to-date basis.
As one of the fastest growing communities in the Edmonton Metropolitan Region, Leduc continues to attract buyers looking for affordability, newer homes, and convenient access to Edmonton and the international airport. February’s data shows a market that is becoming more balanced, with higher listing activity and slightly longer selling timelines giving buyers more opportunities while still supporting strong home values.
Let’s break down what happened in the Leduc housing market during February and what it means for buyers and sellers heading into the spring market.
Key Leduc Real Estate Statistics | February 2026
Sold Properties: 56
Average Sale Price: $450,000
Average Asking Price: $515,000
New Listings: 104
Average Days on Market: 71 days
Average Ask-to-Sell Ratio: 0.983
These numbers illustrate a market that remains active but is shifting slightly compared to the strong seller conditions seen earlier in 2025.
📊 New Construction Data Provided
New Construction Sales (13 homes):
Average List Price: $561,382
Average Sold Price: $554,653
Median Sold Price: $524,900
Days on Market (Avg): 62
These are significantly higher than the overall market averages, which means they will pull numbers upward.
Interactive bar graphs
Leduc New MLS® Listings
New Listings Surge in February
One of the most significant shifts in February’s market data was the increase in listing activity.
104 new properties were listed for sale in Leduc during February, representing a 57.58% increase compared to February 2025.Year-to-date, 195 homes have been listed compared to 130 last year, marking a 50% increase in available inventory. This surge in listings provides buyers with far more options and contributes to the longer selling timelines seen this year.
For sellers, this means pricing and presentation will be increasingly important as competition grows heading into the busy spring market.
Average List Price
Seller confidence remained strong in February.
The average asking price in Leduc reached $515,000, representing a 3.71% increase compared to February 2025. On a year-to-date basis, the average list price now sits at $511,000 compared to $492,000 last year, reflecting a 3.77% increase in seller expectations. This growth suggests that homeowners are still optimistic about the value of their properties and that pricing trends continue to move upward even as the pace of sales adjusts.
For sellers considering listing their homes this spring, this is encouraging news as it indicates that demand remains strong enough to support price growth.
Leduc Home Sales
A total of 56 homes sold in Leduc in February 2026, representing an 18.84% decrease compared to February 2025.While the drop in sales may appear significant at first glance, it is important to view it in context. Early 2025 saw unusually strong activity across many markets in the Edmonton region. As interest rates stabilized and inventory increased, the pace of sales began to normalize.
On a year-to-date basis, 96 homes have sold in Leduc so far in 2026 compared to 112 during the same period in 2025, representing a 14.29% decrease in sales activity. This shift suggests the market is adjusting toward a more balanced environment where buyers have more time to evaluate options rather than competing aggressively for limited inventory.
Average Sale Price
Despite the dip in sales activity, home values in Leduc remain strong.
The average sale price in February 2026 was $450,000, representing only a 0.90% decrease compared to February 2025. While this small decline may appear notable, it is important to look at the broader trend. When we examine the year-to-date numbers, the average sale price in 2026 sits at $451,000 compared to $438,000 in 2025, representing a 3.10% increase in home values overall. This indicates that the Leduc real estate market is maintaining healthy long-term appreciation despite short-term fluctuations.
For homeowners, this continued growth reinforces the long-term investment potential of property ownership in Leduc.
Ask-to-Sell Ratio
The average ask-to-sell ratio in February was 0.983, meaning homes sold for about 98.3% of their asking price. This represents a 1.34% decline compared to last year, suggesting buyers are negotiating slightly more than they were previously.
While this shift may appear minor, it reflects a market gradually moving away from peak seller conditions toward a more balanced environment.
Average Days on Market
The average days on market in February increased to 71 days, representing a 20.34% increase compared to February 2025. Looking at the broader trend, the year-to-date average days on market sits at 79 days compared to 57 days last year, representing a 38.60% increase. Longer selling times are typical when inventory rises. Buyers simply have more homes to choose from and therefore take more time making decisions.
For sellers, this emphasizes the importance of:
Proper pricing
Professional photography
Strategic marketing
Effective staging
Homes that are priced correctly and show well will still sell faster than the average.
📊 Leduc Year-To-Date Market Comparison
2026 vs 2025 (January–February)
Metric
2026 YTD
2025 YTD
% Change
Sold Properties
96
112
↓ 14.29%
Average Asking Price
$511,000
$492,000
↑ 3.77%
Average Sale Price
$451,000
$438,000
↑ 3.10%
New Listings
195
130
↑ 50.00%
Days on Market
79
57
↑ 38.60%
Ask-to-Sell Ratio
0.981
0.993
↓ 1.25%
Key Takeaway
Although sales activity is slightly lower in early 2026, both average list prices and sale prices are trending upward, indicating that property values in Leduc continue to appreciate. The major shift so far in 2026 has been a significant increase in listing inventory, which is giving buyers more options and slightly extending the time it takes homes to sell.
What This Means for Buyers
For buyers considering entering the Leduc real estate market, the current environment offers several advantages.
Inventory is increasing, giving buyers more homes to choose from and reducing the likelihood of intense bidding wars. With homes taking longer to sell, buyers may also find greater negotiating opportunities on price or conditions.
However, buyers should still be mindful that property values continue to trend upward year-over-year. Waiting too long to purchase could mean paying more later as the market strengthens during the spring season.
What This Means for Sellers
For sellers, the market remains strong but requires a more strategic approach than in previous years.
With inventory increasing significantly, buyers now have more choices. This means homes must be priced competitively and marketed effectively in order to stand out.
Sellers who prepare their homes properly and work with an experienced REALTOR® can still achieve excellent results.
Leduc Continues to Attract Buyers
Leduc remains one of the most attractive communities in the Edmonton region thanks to its combination of affordability, lifestyle amenities, and strong community growth.
Buyers continue to be drawn to neighbourhoods such as:
Black Stone
Southfork
Robinson
Meadowview Park
West Haven
Deer Valley
Woodbend
These communities offer modern homes, family-friendly amenities, and convenient commuting options for those working in Edmonton or at the Edmonton International Airport.
What These Numbers Mean for the Spring 2026 Market in Leduc
Looking ahead, the February data provides some early clues about what we can expect for the upcoming spring real estate market in Leduc. The most notable shift so far in 2026 has been the significant increase in new listings, which are already up 50% year-to-date compared to the same time last year. This increase in inventory suggests that more homeowners are preparing to sell, likely anticipating strong buyer demand as we move into the traditionally busy spring season. While sales activity is currently slightly lower than last year, this is not unusual for the early months of the year and may simply reflect buyers taking more time to evaluate their options with the increased selection available. Home prices, however, remain resilient — with year-to-date average sale prices still up over 3% compared to 2025. As we move into March, April, and May, we can expect the Leduc housing market to become more active as warmer weather brings more buyers into the market. If inventory continues to rise at the current pace, conditions may shift toward a more balanced market, where buyers benefit from greater choice while sellers still experience strong property values and steady demand.
Thinking of Buying or Selling in Leduc?
Whether you are planning to buy your first home, upgrade to a larger property, or sell your current home, understanding the local market is key to making informed decisions.
If you would like a personalized market analysis or are curious about the value of your home, I would be happy to help.
Chris Reid
Century 21 Leading
📞 (780) 717-5267
📧 creid@chrisreidedmonton.com
If you would like more information on the Leduc real estate market contact Chris Reid
Built Green Gold & CMHC Eco Plus Rebate: A 2026 Edmonton New Construction Guide
When you’re buying a brand-new home in Edmonton — whether it’s in Keswick, Kinglet Gardens, The Orchards, or any other vibrant community — understanding the rebates and incentives available to you can make a big difference in your home-buying budget.
One of the most valuable incentives for energy-efficient new homes is the CMHC Eco Plus Rebate, which offers a refund on your mortgage loan insurance premium when you purchase a newly built, energy-efficient home that qualifies under selected green certification standards — including Built Green® Gold.
This guide breaks down what the Eco Plus rebate is, how Built Green® Gold fits into it, who qualifies, and exactly how Edmonton buyers can take advantage.
Understanding the CMHC Eco Plus Rebate
The Canada Mortgage and Housing Corporation (CMHC) is Canada’s national housing agency. One of the ways CMHC helps Canadians afford homeownership — and supports national energy-efficiency goals — is through the Eco Plus Rebate (previously known as the CMHC Green Home rebate).
Here’s the core idea:
If you buy or build a new energy-efficient home and your mortgage is insured by CMHC, you may qualify for a refund of up to 25% of your CMHC mortgage loan insurance premium.
Mortgage loan insurance is typically required if your down payment is less than 20%, and it protects the lender if you can’t repay your mortgage. The Eco Plus rebate basically gives you back a portion of that insurance cost — putting real money back into your hands.
Why This Matters in Edmonton
In the Edmonton market, many new construction homes — from townhomes to detached houses — are now being marketed with energy-efficient features. Builders are increasingly focused on higher performance, not only because it’s better for homeowners — lower utility costs, better comfort — but also because it aligns with federal and provincial efficiency goals.
The Eco Plus rebate provides a financial incentive to choose these high-performance new homes — and it can mean thousands back at closing or after your purchase.
What Does “Energy-Efficient” Mean for This Rebate?
To qualify for the CMHC Eco Plus rebate, the home must be:
📌 Financed with mortgage insurance from CMHC
📌 A newly built home that has never been occupied
📌 Energy-efficient — meaning it has an official certification or meets a high energy efficiency rating
Homes that meet recognized energy-efficiency standards — like Built Green® Gold, ENERGY STAR®, R-2000, or similar programs — automatically qualify for the full 25% refund.
One such standard is Built Green® Gold certification — a widely respected program in Canada that verifies a home’s energy performance, building envelope quality, and efficiency measures. Homes built to this standard are considered “green” and energy efficient enough to qualify for the 25% premium refund under CMHC’s Eco Plus program.
Built Green® Gold: What It Means
Built Green Canada offers different certification levels for homes based on energy efficiency and sustainability measures. A Built Green® Gold home has been constructed with features that improve energy performance, insulation, and overall environmental impact compared to a standard build.
In practical terms, this means:
Better insulation and airtightness
High-efficiency windows and doors
High-efficiency heating and ventilation systems
Reduced energy consumption and utility costs
When a home is Built Green® Gold certified, it’s automatically recognized under CMHC’s Eco Plus program as eligible for the 25% rebate on the mortgage insurance premium.
How Much Can Edmonton Buyers Save?
Let’s put this into a typical Edmonton example.
Imagine you’re putting down 10% on a $500,000 newly built home built to Built Green® Gold standards:
That rebate could mean almost $3,500 back in your pocket. You could use it for closing costs, furniture, landscaping, or simply to save on your upfront expenses.
That’s money that many Edmonton buyers overlook — but it’s real savings tied to choosing a high-performance home.
Who Is Eligible?
To qualify for the Eco Plus rebate, you must:
✔ Finance your home with CMHC mortgage loan insurance
✔ Purchase or build a newly constructed home that has never been occupied
✔ Provide a certificate showing the home meets a recognized energy-efficiency standard (like Built Green® Gold) or demonstrate a strong energy efficiency rating under the EnerGuide system (NRCan)
You have a 24-month window from the date of closing to apply for the rebate, so you don’t necessarily need to claim it right at closing — but you do need to submit within that timeframe.
How to Apply – Step by Step
Here’s how you would apply for the CMHC Eco Plus rebate as an Edmonton buyer:
Confirm the Home Qualifies
Ask your builder whether the home is Built Green® Gold certified or meets an eligible energy-efficiency standard.
Obtain Documentation
You’ll need a certificate from the builder or an EnerGuide label confirming the home’s performance.
Ensure Your Mortgage Is CMHC-Insured
If your down payment is less than 20%, mortgage loan insurance through CMHC is required — which makes you eligible for the rebate.
Complete the Rebate Application
Fill out the Eco Plus rebate form on the CMHC website. You will include your mortgage insurance details and the energy certification documentation.
Submit Within 24 Months of Closing
CMHC allows up to two years after closing to file the rebate application.
Once approved, CMHC refunds up to 25% of the premium directly to you.
Beyond the Rebate: Long-Term Value
The CMHC Eco Plus rebate isn’t just a one-time refund — it’s part of a larger value equation:
📉 Lower Energy Bills Over Time
Energy-efficient homes, like those Built Green® Gold certified, tend to consume less energy, which can mean lower utility bills year after year.
📈 Higher Resale Value
Energy-efficient homes are increasingly valued by buyers who know they will save on heating, cooling, and maintenance costs.
🌿 Better Comfort & Indoor Air Quality
Built Green® homes often offer better ventilation, improved insulation, and a more comfortable year-round living environment.
So it’s not just a rebate — it’s an investment in long-term affordability and comfort.
Why Edmonton Buyers Should Care
Edmonton’s real estate market has changed dramatically in recent years. With rising construction costs and interest rates remaining an important factor, buyers are seeking any advantage that improves affordability without compromising quality.
Choosing energy-efficient new construction that qualifies for rebates like Eco Plus gives you:
Immediate savings at closing
Ongoing savings on monthly energy costs
Strong resale potential
These are financial benefits you can evaluate alongside neighbourhood, schools, commute times, and builder reputation — not after the fact.
Questions to Ask Before You Buy
When you’re touring new construction homes in Edmonton, make sure to ask:
🔹 “Is this home Built Green® Gold certified?”
🔹 “Does this home qualify for the CMHC Eco Plus rebate?”
🔹 “Can you provide the certificate or EnerGuide rating?”
🔹 “Has my mortgage insurer included this rebate info?”
These simple questions can determine whether you leave thousands of dollars on the table — or take advantage of government-backed savings.
Finding Homes That Qualify
Not all new builds in Edmonton automatically qualify for the Eco Plus rebate — only those that meet recognized energy-efficiency standards like Built Green® Gold or equivalent.
When you’re working with a realtor, make sure they filter available inventory for homes that:
Are newly built and never lived in
Have high energy performance ratings or certifications
Come from builders familiar with green-building standards
Builders who are experienced with certified energy-efficient homes often highlight these features in their floor plans and marketing materials — and rightly so. These features benefit both your lifestyle and your bottom line.
Real Stories from Edmonton Buyers
Here’s how this has worked for Edmonton homeowners:
🔹 Young Couple, West Edmonton — Qualified for a 25% rebate on mortgage insurance when purchasing a Built Green® Gold townhome. The rebate helped cover closing costs.
🔹 Family in Southeast Edmonton — Bought a new energy-efficient detached home. The rebate, combined with lower utility bills, made the monthly cost more affordable than expected.
🔹 First-Time Buyer in North Edmonton — Used the rebate toward furniture and landscaping, improving move-in comfort.
These are real examples of how seemingly small rebates can have a big impact on your total home purchasing experience.
Building Green Is a Smart Move — Financially and Environmentally
The Eco Plus rebate isn’t just a financial incentive — it’s part of a broader trend toward sustainable home building that benefits:
🌎 The environment 💰 Your wallet 🏡 Your long-term comfort
In Edmonton’s competitive new construction market, buyers who understand and leverage these incentives are in a better position to make smart, informed decisions that pay off for years.
Final Thoughts
If you’re considering a newly built home in Edmonton — whether in a master-planned community, a quiet family neighbourhood, or a modern infill project — the CMHC Eco Plus rebate deserves a spot on your decision checklist.
Here’s how it ties into your move:
✔ Real savings (up to 25% refund on CMHC mortgage insurance) ✔ Applies to energy-efficient homes like Built Green® Gold certified homes ✔ Requires documentation and application within 24 months of mortgage closing ✔ Can improve overall affordability and reduce long-term costs ✔ Supports a sustainable lifestyle
Don’t just buy a home — buy a home that works for you financially and environmentally.
GST Rebate on New Homes in Edmonton: What Buyers Need to Know in 2026
If you're buying a brand-new home in Edmonton — whether it’s a quick possession in Keswick, a duplex in Kinglet Gardens, a detached home in Orchards, or a pre-construction build in Sherwood Park — there’s one financial detail you absolutely need to understand:
GST.
In Alberta, new construction homes are subject to 5% federal GST. And on a $500,000 home, that’s $25,000.
The good news? Many buyers may qualify for the GST New Housing Rebate, and first-time buyers may qualify for even more relief under the proposed federal First-Time Home Buyers GST Rebate.
Let’s break down what this means for Edmonton new construction buyers — and how it impacts your purchase strategy.
How GST Works on New Construction in Edmonton
In Alberta, we do not have provincial HST — only the 5% federal GST applies.
When you purchase:
A brand-new home from a builder
A substantially renovated home
A new duplex, townhome, or condo
Or you build your own home
GST applies to the purchase.
Most builders in Edmonton advertise homes as “GST included.” What that usually means is they are assuming you qualify for the GST New Housing Rebate and have already factored that rebate into the advertised price.
But here’s the critical part:
If you don’t qualify for the rebate, that amount can be added back to your purchase price.
That’s why understanding eligibility is so important before you sign a builder contract.
What Is the GST New Housing Rebate?
The GST New Housing Rebate allows eligible individuals to recover a portion of the GST paid on a new or substantially renovated home that will be used as a primary residence.
In Edmonton’s new construction market, this applies to:
Single-family detached homes
Duplexes and half-duplexes
Townhomes
Condominiums
Homes on leased land (with qualifying lease terms)
Mobile and modular homes
Floating homes
Owner-built homes (with conditions)
To qualify, you must:
Be purchasing as an individual (not a corporation)
Intend to use the home as your primary residence (or for a close family member)
Buying From a Builder in Edmonton
If you purchase a new home from a builder in Edmonton — whether that’s in southwest communities like Glenridding Ravine or Riverstead, west Edmonton communities like Kinglet Gardens, or southeast areas like The Orchards — you may qualify for the rebate.
Most builder contracts include a clause stating:
The purchase price includes the GST rebate, and the buyer agrees to assign the rebate to the builder.
This means the builder applies for the rebate on your behalf and credits it toward the purchase price.
However, if you do not qualify, you must repay that rebate amount.
This can significantly affect:
Your final purchase price
Your mortgage approval amount
Your closing costs
That’s why I always review this clause carefully with my buyers before they remove conditions.
Building Your Own Home in Edmonton or Surrounding Areas
If you’re building a custom home — whether in Edmonton proper, Parkland County, Sturgeon County, or Strathcona County — you may still qualify for the GST rebate.
However, there is a key condition:
The fair market value of the home at substantial completion must be under $450,000.
With today’s build costs in the Edmonton area, many detached homes exceed this threshold, which may limit or eliminate eligibility for owner-built rebates.
If you’re planning a custom build, we need to run those numbers carefully before moving forward.
Modular, Mobile & Specialty Homes
If you’re purchasing a new modular or mobile home in Edmonton or surrounding communities, you may still qualify.
In some cases, you can choose whether to treat it as:
A builder purchase
Or an owner-built home
That distinction affects how the rebate is calculated.
The Proposed First-Time Home Buyers GST Rebate
There is also a proposed federal program that would significantly increase relief for first-time home buyers.
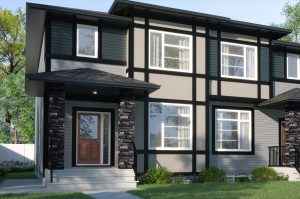
The Hudson Duplex by Rohit Homes is a bold designer paired home offering 1,585 square feet, 3 bedrooms, and 2.5 bathrooms in a smart, functional layout designed to make everyday living easier
With its open-concept main floor, gourmet kitchen featuring an expansive peninsula, versatile second floor, and optional basement development (including a legal secondary suite), the Hudson is ideal for growing families, first-time buyers, and investors alike.
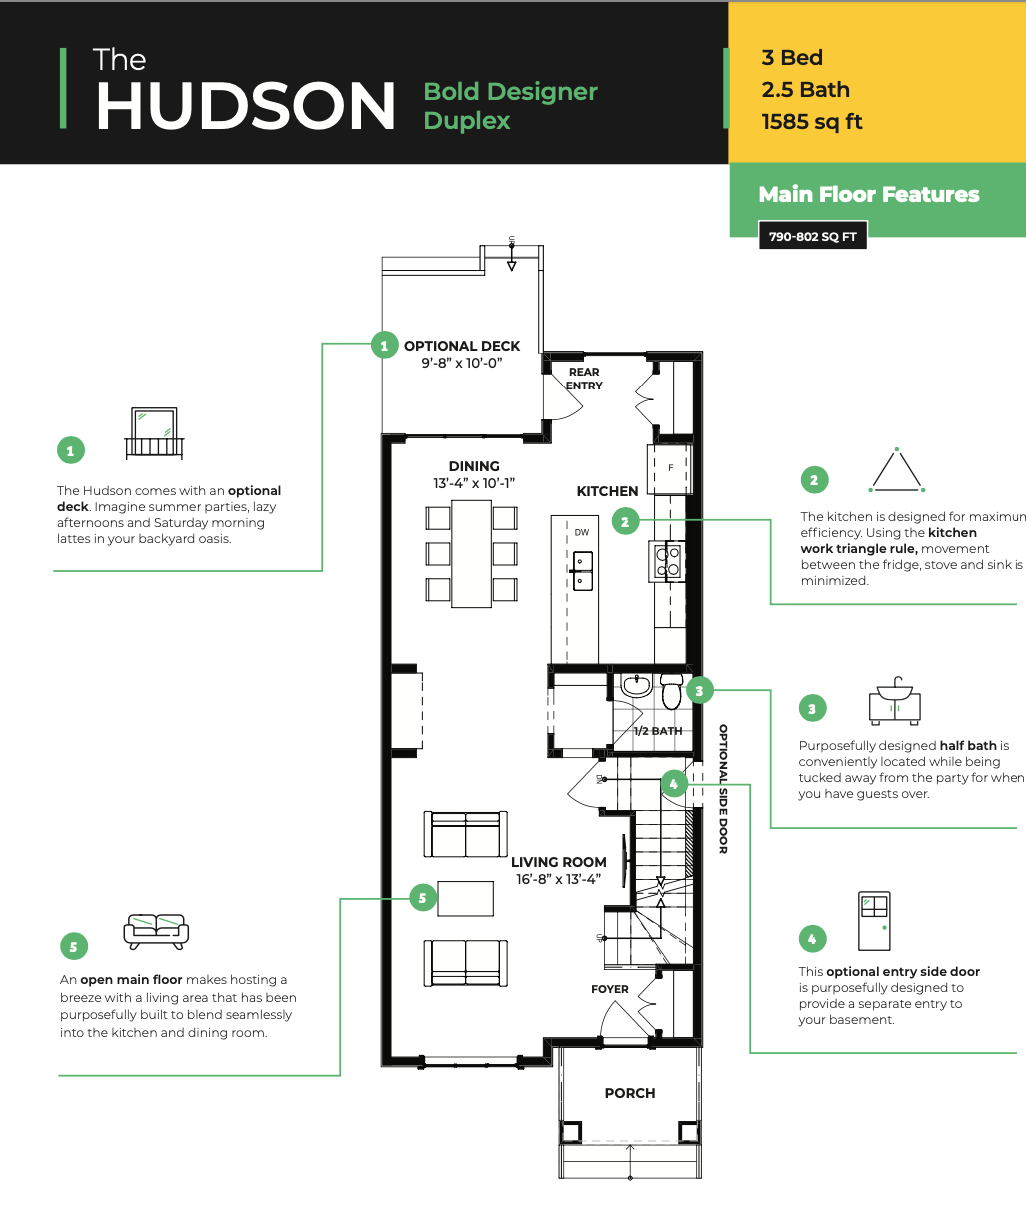
Hudson Duplex Model Overview
1,585 sq ft
3 bedrooms
2.5 bathrooms
Open-concept main floor
Upper-floor laundry
Optional deck
Optional side entrance
Optional developed basement
Optional legal secondary suite
This duplex balances affordability with thoughtful design — a signature of Rohit’s Bold Designer series.
Main Floor Living & Layout
Main Floor Features (790–802 sq ft)
The Hudson’s main floor is purposefully designed for hosting, comfort, and daily efficiency
2025 02 06 Hudson Duplex
.
Open-Concept Living
The living room (16’8” x 13’4”) blends seamlessly into the dining and kitchen areas, creating a cohesive entertaining space
. Whether you’re hosting family gatherings or enjoying quiet evenings, the layout supports flexibility.
Gourmet Kitchen with Expansive Peninsula
The kitchen (13’4” x 10’1”) follows the classic work triangle rule, minimizing movement between fridge, stove, and sink for optimal functionality
The oversized peninsula provides:
Extra prep space
Casual seating
Clear sightlines to the living room
Optional Deck
The Hudson offers an optional 9’8” x 10’0” deck, ideal for summer evenings, morning coffee, and backyard entertaining
Smart Half Bath Placement
The main floor half bath is tucked away from the main entertaining areas — convenient for guests while maintaining privacy
Optional Side Entrance
A standout feature: the optional side door is intentionally designed to provide separate basement access — a key feature if you’re planning future development or rental potential
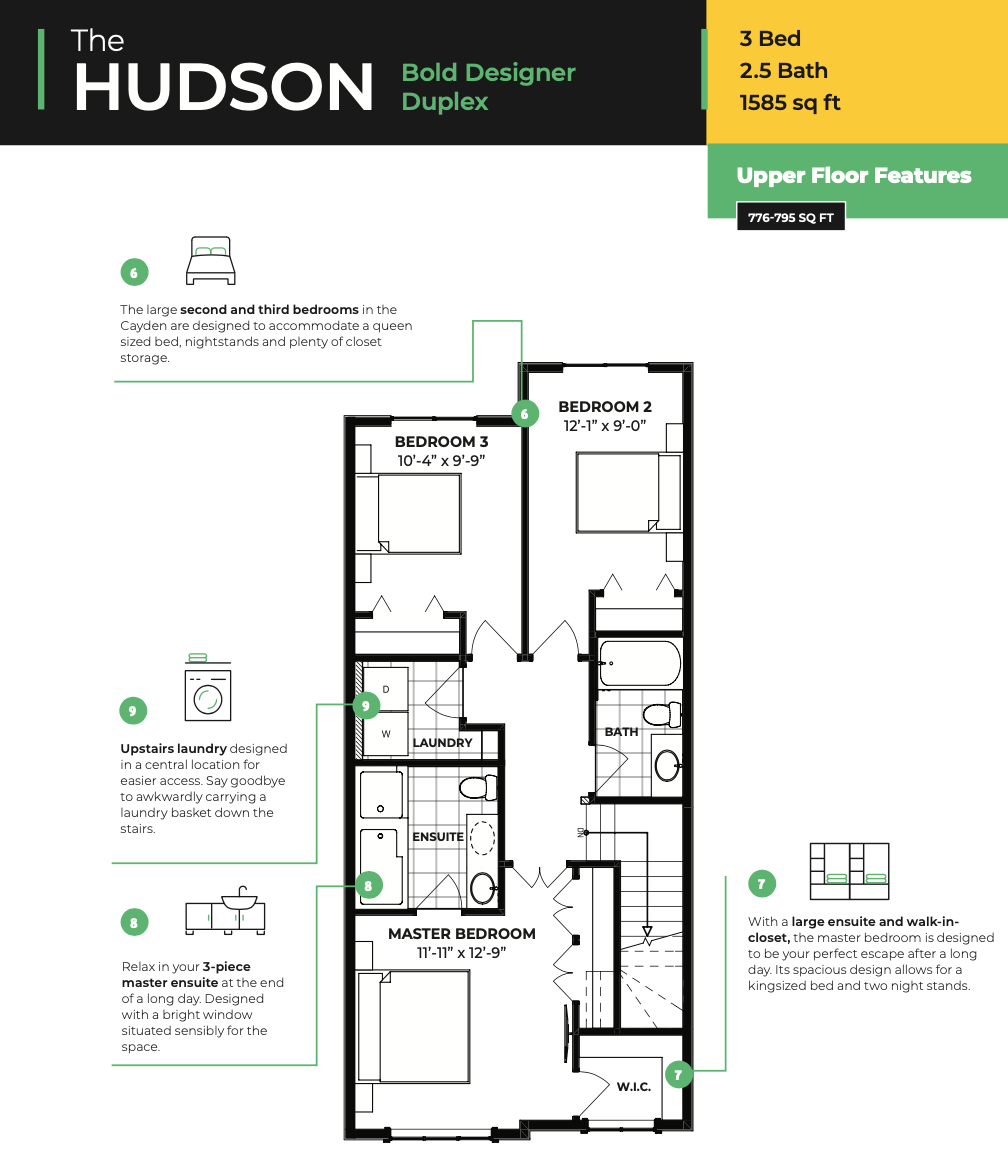
Upper Floor Layout (776–795 sq ft)
The second floor of the Hudson duplex is designed to balance private retreat spaces with practical everyday living
Spacious Primary Bedroom
The primary bedroom measures 11’11” x 12’9” and is designed to comfortably fit a king-size bed and nightstands
It includes:
Large walk-in closet
3-piece ensuite with bright window placement
Generously Sized Secondary Bedrooms
Bedroom 2 (12’1” x 9’0”) and Bedroom 3 (10’4” x 9’9”) are intentionally sized to accommodate queen beds, nightstands, and proper storage — not “afterthought” rooms
Upper-Floor Laundry
The Hudson features centrally located upstairs laundry, eliminating the need to carry baskets between floors
Optional Legal Secondary Suite
The Hudson also offers a legal basement suite configuration, designed specifically for rental income potential
The suite includes:
Separate bedroom
Kitchen/dining area
Living room
Bathroom
Dedicated laundry for renters
This option makes the Hudson especially attractive for:
Investors
Multigenerational families
Buyers offsetting mortgage costs
Interior Designer Packages
The Hudson is available in Rohit Homes’ curated designer interior collections:
Neo – clean, modern, minimalist
Haute – bold, refined, designer-inspired
Zen – warm, balanced, and calming
These packages eliminate upgrade guesswork while maintaining a cohesive aesthetic.
Who the Hudson Duplex Is Ideal For
The Hudson is a strong fit for:
First-time home buyers
Families needing 3 bedrooms
Buyers planning long-term ownership
Investors interested in legal suite potential
Homeowners who want modern design in a manageable footprint
Why the Hudson Stands Out
✔ Expansive kitchen peninsula ✔ True three-bedroom layout ✔ Upstairs laundry ✔ Optional side entrance ✔ Legal suite potential ✔ Strong square footage for a duplex
At 1,585 sq ft, the Hudson lives larger than many comparable duplex models in Edmonton
Explore the Hudson Duplex with Confidence
If you’re considering the Hudson Duplex by Rohit Homes, I can help you compare:
Rural Strathcona County Real Estate Market Update – January 2026
The 2026 acreage market is officially underway in Rural Strathcona County, and while January numbers are typically quieter due to seasonality, the data reveals something important: pricing strength remains very strong, even as overall sales volume slowed.
If you're buying or selling an acreage this year, these early numbers give us valuable insight into what we can expect for the spring market ahead.
Let’s break down what happened in January 2026.
📊 January 2026 Market Snapshot
According to the official January 2026 report
Sold Properties: 6 (↓ 71.43% vs January 2025)
New Listings: 26 (↓ 10.34%)
Average Sale Price: $1.01M (↑ 12.36%)
Average Asking Price: $1.11M (↑ 3.08%)
Days on Market: 114 (↓ 35.96%)
Ask-to-Sell Ratio: 0.994 (↑ 3.08%)
Even with fewer sales, the story here is clear: acreage values remain strong and buyers are paying close to asking price. Noting 1 sale was at $1,450,000
Bar graphs below are interactive
Strathcona County -Acreage Listings
🆕 New Listings: Inventory Building Ahead of Spring
There were 26 new acreage listings in January, slightly down 10.34% from last year.
This is typical for early Q1:
Some sellers wait until March/April.
Others list early to capture motivated winter buyers.
If this pace continues, we may see tighter inventory heading into the spring market — which could support continued price growth.
Strathcona County - Average Acreage List Price
💵 Asking Prices Continue to Climb
The average asking price in January was $1.11M, up 3.08% year-over-year.
While this increase is more moderate than the jump in sale price, it suggests:
Sellers are confident in the market.
Pricing strategies are aligning more closely with buyer expectations.
The gap between list price and sale price is tightening.
Strathcona County -Acreage Sales
🏡 Sales Activity: A Typical Seasonal Slowdown
Only 6 acreages sold in January 2026, compared to 21 in January 2025. That’s a 71% decrease year-over-year — but context matters.
January is historically one of the slowest months in the rural market due to:
Weather conditions
Holiday carryover
Fewer active buyers
Sellers waiting for spring
This drop does not indicate weakness in the market — it reflects seasonality.
What matters more is pricing behaviour — and that’s where things get interesting.
Average Sale Price
💰 Average Sale Price Surpasses $1 Million
The average sale price in January 2026 reached $1.01M, marking a 12.36% increase over January 2025.
This is a major milestone.
Despite lower transaction volume:
Buyers paid significantly more.
Luxury and upper-tier properties likely dominated the sales mix.
Sellers maintained strong pricing power.
The chart on page 1 of the report shows a noticeable upward trend in the monthly sales price line entering January 2026 — reinforcing that pricing momentum carried into the new year.
For acreage owners, this is a powerful signal: values remain elevated heading into spring.
🤝 Ask-to-Sell Ratio: Nearly Full Price Sales
One of the strongest indicators in this report is the 0.994 ask-to-sell ratio.
That means homes sold for 99.4% of asking price.
This is exceptionally strong — especially in January.
For sellers:
Negotiation margins are minimal.
Properly priced acreages are commanding near-full price.
Overpricing remains risky, but correct pricing is rewarded.
For buyers:
There is very little room for deep discounts.
Strong, clean offers are necessary to secure desirable properties.
Strathcona County Acreage Average Days on Market
⏱️ Days on Market: Significant Improvement
January acreages averaged 114 days on market, which is actually a 35.96% improvement from January 2025’s 178 days.
That’s a substantial shift.
Although 114 days may seem long compared to city homes, acreage properties naturally have longer timelines due to:
Larger price points
More complex inspections (well, septic, outbuildings)
Specialized buyer pool
The improvement tells us:
Serious buyers are still active.
Well-priced homes are moving faster than last year.
Market efficiency is improving.
📈 YTD 2026 vs YTD 2025 Comparison
Since January is the first month of the year, YTD reflects January only — but the comparison still shows important shifts:
Metric
YTD 2026
YTD 2025
% Change
Sold Properties
6
21
↓ 71.43%
Average Sale Price
$1.01M
$903K
↑ 12.36%
Average Asking Price
$1.11M
$1.08M
↑ 3.08%
Days on Market
114
178
↓ 35.96%
Ask-to-Sell Ratio
0.994
0.964
↑ 3.08%
strathcona county
The takeaway?
Lower volume. Higher value. Faster turnover. Stronger negotiating power for sellers.
That’s a powerful combination entering spring.
🔎 What This Means for Buyers in 2026
If you're planning to buy an acreage this year:
Expect continued strength in pricing.
Be prepared for near-asking-price negotiations.
Move quickly on well-maintained properties.
Ensure financing is fully pre-approved before shopping.
The January data suggests buyers are not aggressively negotiating — they’re paying close to list price for quality properties.
🏡 What This Means for Sellers in 2026
If you're considering selling your acreage this year:
The $1.01M average sale price is a strong signal.
Inventory is not flooding the market.
Buyers are paying nearly full price.
Days on market are improving.
You may not need to wait until late spring to list.
Strategic early listings can capture:
Relocation buyers
Lifestyle movers
Buyers who sold in Edmonton in late 2025
📊 Visual Trends from the Report
The graph on page 1 of the report shows:
A consistent upward trend in average sale prices since mid-2024.
A notable price spike entering January 2026.
Sales volume dipping seasonally but not collapsing structurally.
This confirms that January’s lower sales volume is cyclical — not market weakness.
🔮 What to Expect for Spring 2026
Based on January’s data, here’s what I anticipate:
Strong spring pricing.
Potential upward pressure if inventory remains moderate.
Competitive conditions for move-in-ready acreages.
Continued strength in $900K–$1.2M price brackets.
If rates remain stable, the acreage market in Strathcona County could see another strong Q2.
🌾 Final Thoughts
January 2026 may have started quietly in terms of volume, but it started loudly in terms of value.
With:
Sale prices up 12.36%
Ask-to-sell ratio at 99.4%
Days on market improving
Inventory moderate
The Rural Strathcona County acreage market enters 2026 in a position of strength.
📞 Thinking About Buying or Selling an Acreage?
If you’d like a customized market evaluation for your acreage or want to start planning your spring purchase:
Chris Reid – Century 21 Leading
📞 (780) 717-5267
🌐 chrisreidedmonton.com
📧 creid@chrisreidedmonton.com
Acreage real estate is different — and working with someone who understands wells, septic systems, zoning, shops, and rural negotiations makes all the difference.
Data provided by the REALTORS® Association of Edmonton and subject to change. Always consult with a real estate professional for the most current market information.
Looking to Buy or Sell Acreages in Strathcona County?
Whether you're a buyer eager to find your perfect rural retreat or a seller ready to capitalize on this favourable market, I’m here to help. Reach out to explore available properties or to discuss your goals.
Beaumont Real Estate Market Update: January 2026 Statistics
The Beaumont real estate market opened 2026 with renewed energy. After a slower finish to 2025, January delivered a noticeable uptick in sales activity, rising listing inventory, and a rebound in sale prices. While winter markets are typically quiet, this year Beaumont is showing early signs of momentum heading into spring.
If you’re considering buying, selling, or investing in Beaumont, understanding these early-year trends is critical. Let’s break down exactly what happened in January 2026 and what it could mean for the months ahead.
📊 January 2026 Market Summary
Metric
January 2026
January 2025
% Change
Sold Properties
21
16
↑ 31.25%
New Listings
64
46
↑ 39.13%
Average Asking Price
$584,000
$601,000
↓ 2.70%
Average Sale Price
$519,000
$491,000
↑ 5.75%
Days on Market
87
79
↑ 10.13%
Ask-to-Sell Ratio
97.9%
98.4%
↓ 0.47%
Interactive bar graphs
Beaumont New MLS® Listings
🏘️ New Listings Jump Nearly 40%
January also brought 64 new listings, compared to 46 last year — a 39.13% increase.
That is significant inventory growth for a winter month.
This tells us:
Sellers are entering the market sooner instead of waiting for spring.
Builders are actively releasing new inventory.
Competition among sellers will increase moving into February and March.
Higher inventory gives buyers more choice — but it also requires sellers to price sharply.
Average Asking Price
💰 Average Asking Price Softens Slightly
The average asking price landed at $584,000, down 2.70% from $601,000 last January.
This modest decline suggests:
Sellers are adjusting expectations after late-2025 price corrections.
Pricing strategies are becoming more realistic.
Homes are entering the market closer to true market value.
This is a healthy sign — especially paired with rising sales volume.
Beaumont Home Sales
📈 Sales Activity Surges 31%
Beaumont recorded 21 residential sales in January 2026, up from 16 last January — a 31.25% increase year-over-year.
That’s a strong start to the year.
Winter markets often see hesitation, but the monthly sold properties chart in the report clearly shows January outperforming the previous year. This indicates:
Buyers are returning earlier than expected.
Rate stabilization may be restoring confidence.
Pent-up demand from late 2025 is releasing into the market.
This is a positive signal heading into Q1.
Average Sale Price
📊 Sale Prices Rebound 5.75%
The most encouraging statistic in January is the average sale price, which climbed to $519,000, up 5.75% year-over-year.
This indicates:
Buyers are paying strong values for well-priced homes.
The late-2025 price softness may have stabilized.
Mid-range homes ($450K–$600K) are moving effectively.
The monthly sales price chart in the report shows pricing stabilizing after fluctuations throughout 2025.
This is a positive signal for sellers preparing for spring.
📉 Ask-to-Sell Ratio at 97.9%
The average ask-to-sell ratio sits at 97.9%, slightly lower than 98.4% last year.
This means homes are selling about 2.1% below list price on average.
For buyers:
Negotiation room exists.
Conditions are more accepted again.
For sellers:
Overpricing by even 3–4% can stall activity quickly.
Competitive pricing wins early.
Average Days on Market
⏳ Days on Market Increase to 87
Homes took an average of 87 days to sell, compared to 79 days last January — a 10.13% increase.
While this is higher than last year, it’s still consistent with typical winter conditions.
Longer days on market suggest:
Buyers are negotiating more carefully.
Inspection and financing timelines may be stretching slightly.
Pricing still matters significantly.
Homes that are staged well and priced correctly are outperforming the average.
📅 Year-to-Date Snapshot (January 2026 vs January 2025)
Since January is the first month of the year, the YTD figures mirror the monthly totals:
Metric
2026 YTD
2025 YTD
% Change
Sold Properties
21
16
↑ 31.25%
New Listings
64
46
↑ 39.13%
Average Asking Price
$584,000
$601,000
↓ 2.70%
Average Sale Price
$519,000
$491,000
↑ 5.75%
Days on Market
87
79
↑ 10.13%
Ask-to-Sell Ratio
97.9%
98.4%
↓ 0.47%
All data sourced directly from the January 2026 market report
Beaumont
.
🧠 What This Means for Buyers in Beaumont
✔ More inventory than last year
✔ Prices stabilizing after 2025 corrections
✔ Negotiation room exists
✔ Sales momentum building early
If you’re planning to buy in:
Forest Heights
Dansereau Meadows
Montalet
Triomphe Estates
Eaglemont Heights
Now is a smart window before spring competition increases.
💼 What This Means for Sellers
January’s numbers show opportunity — but only with the right strategy.
To succeed:
Price accurately from day one.
Invest in strong photography and marketing.
Be prepared for negotiations.
Understand that 60–90 days on market is normal right now.
The good news? Sale prices are rebounding.
That means buyers are willing to pay — but only for value.
🔮 Early 2026 Market Forecast for Beaumont
Based on January trends, here’s what we may see moving forward:
📈 February and March likely see increased activity
🏗️ Builders continue to release new inventory
💰 Prices stabilize in mid-range homes
📊 Competition increases heading into spring
If interest rates remain steady, Beaumont could experience a strong spring market.
The combination of rising sales and controlled pricing is a healthy signal.
🏡 Should You Buy or Sell Now?
If you’re buying:
You have choice.
You have leverage.
You can negotiate.
If you’re selling:
Buyers are active.
Pricing correctly is critical.
Preparation now sets you up for spring success.
📞 Thinking About Making a Move in Beaumont?
Whether you're buying your first home, upsizing, downsizing, or investing, strategy matters more than ever in today’s market.
As a local REALTOR® serving Beaumont and the greater Edmonton region, I provide:
📲 Call or text Chris Reid at (780) 717-5267 to schedule your free consultation.
Let’s build your 2026 real estate plan with confidence.
Data provided by the REALTORS® Association of Edmonton and subject to change. Always consult with a real estate professional for the most current market information.
If you would like more information on the Beaumont real estate market contact Chris Reid