Facebook
 X
X
 Pinterest
 Copy Link
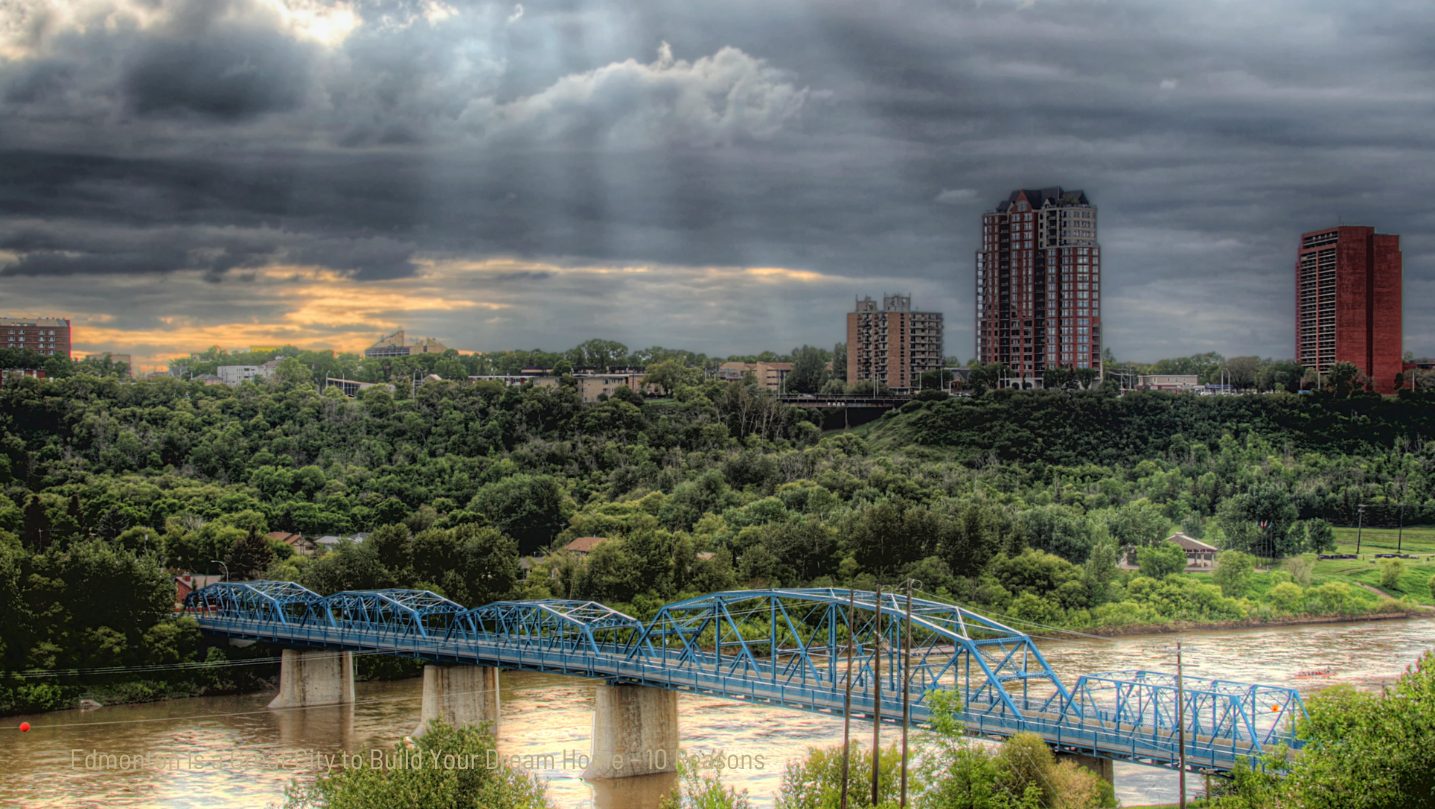
When planning to build your dream home, location is everything. Edmonton, often referred to as the “Gateway to the North,” is more than just Alberta’s capital city—it’s a thriving hub for families, professionals, and anyone seeking a high quality of life. Building a new home in Edmonton offers unparalleled opportunities to create a personalized living space in a city that blends urban amenities with natural beauty. Here are 10 compelling reasons why Edmonton is the perfect place to build your dream home.
1. Affordable Land and Housing Options
One of Edmonton’s most appealing aspects is its affordability compared to other major Canadian cities. The cost of land and construction is more reasonable, allowing homebuyers to get more value for their money. Whether you’re eyeing a spacious lot in a suburban community or a more central location, Edmonton provides diverse options to suit your budget and lifestyle.
2. Thriving Economy
Edmonton boasts a stable and growing economy, driven by industries like energy, technology, education, and healthcare. The city’s economic resilience makes it a great place to invest in real estate. A strong local job market
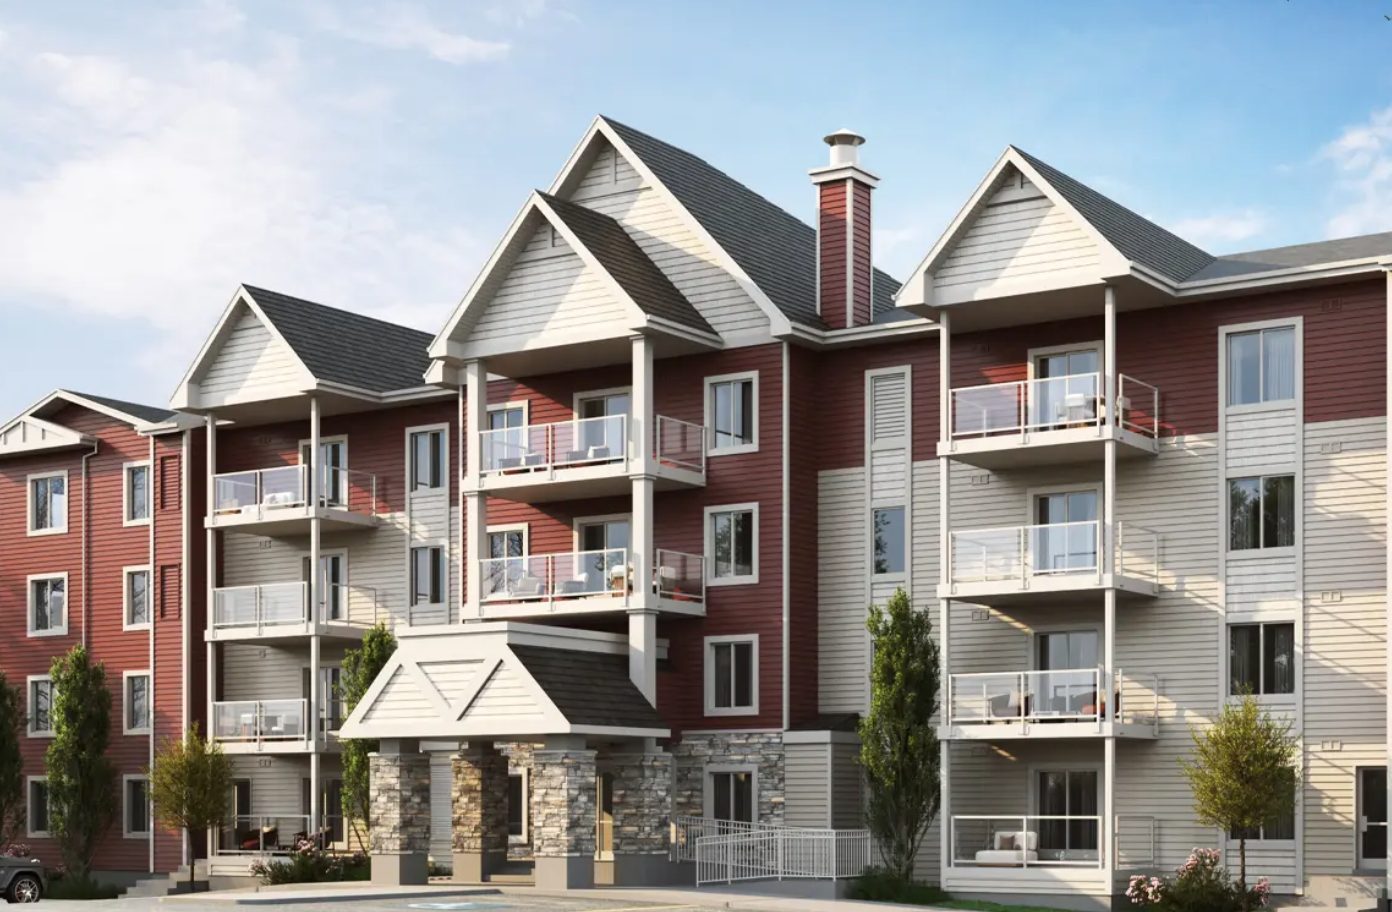
3. A Variety of New Home Communities
Edmonton is home to numerous master-planned communities that cater to a variety of lifestyles. From family-friendly neighbourhoods with excellent schools and parks to luxury communities offering high-end amenities, the city has something for everyone. Popular developments include Windermere, Chappelle Gardens, and Secord.
4. Customization Opportunities
Building a new home in Edmonton means you can work with builders to customize every detail. From floor plans to finishes, you have the freedom to create a home that matches your vision. Edmonton’s builder community offers plenty of choices, ensuring you can find a partner who aligns with your design preferences.
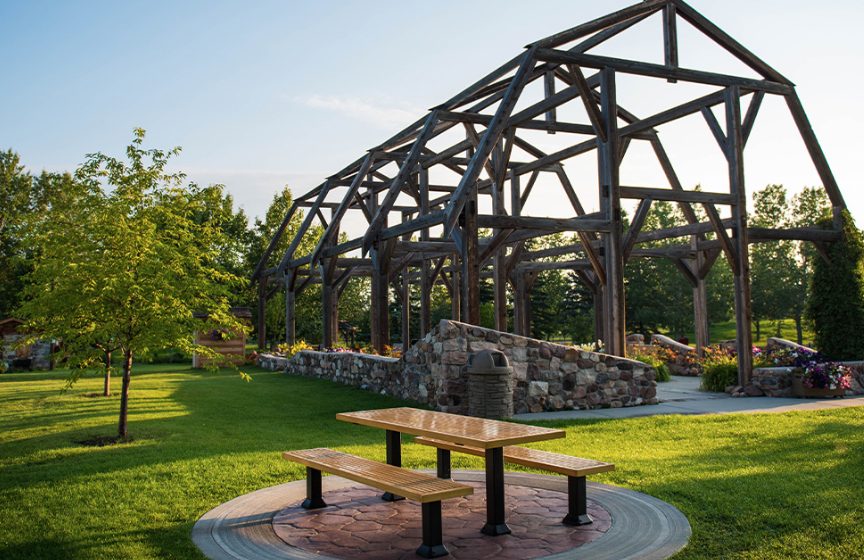
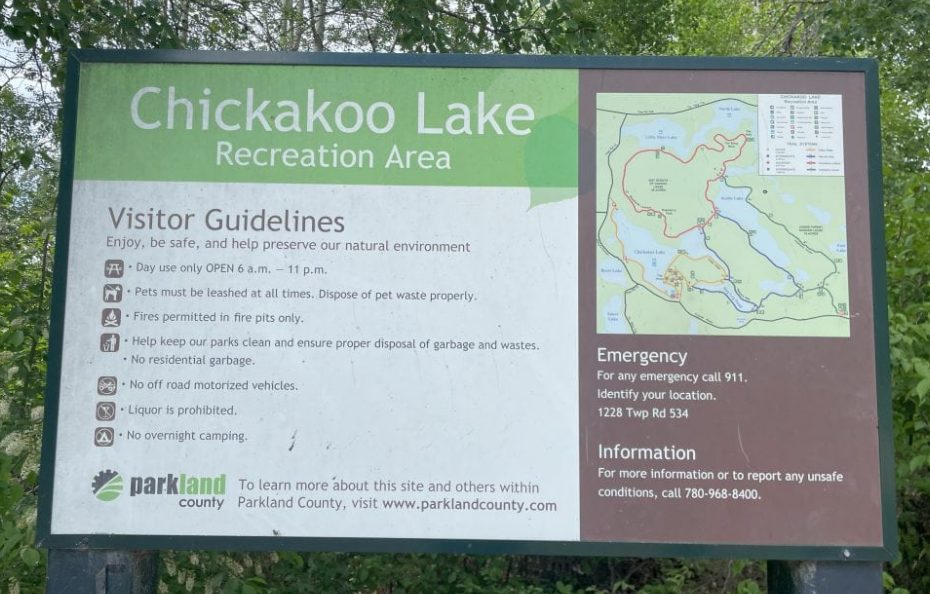
5. Proximity to Nature
Despite being a metropolitan city, Edmonton is known for its green spaces and natural beauty. The North Saskatchewan River Valley, often called the largest urban parkland in Canada, provides countless recreational opportunities. Building a home near these areas allows you to enjoy nature without sacrificing urban conveniences.
6. Family-Friendly Environment
Edmonton is an ideal city for families, with a strong emphasis on education, safety, and recreation. Top-rated schools, abundant playgrounds, and family-oriented activities make it an attractive place to raise children. Many new home developments also feature community centres and family-friendly designs.
7. A Four-Season Lifestyle
Edmonton’s climate offers four distinct seasons, allowing you to enjoy a range of outdoor activities year-round. From skiing in the winter to festivals in the summer, there’s always something to do. Building your dream home in Edmonton means creating a space tailored to make the most of each season.
8. Cultural and Recreational Opportunities
Edmonton is known as Canada’s Festival City for good reason. Events like the Edmonton Folk Music Festival, Fringe Theatre Festival, and Winter City celebrations bring the community together. Additionally, the city offers world-class dining, shopping, and entertainment options to keep you engaged year-round.
9. Accessibility and Infrastructure
Edmonton’s well-planned infrastructure ensures that getting around the city is easy. With extensive road networks, public transit, and proximity to major highways, commuting is a breeze. Building in Edmonton means you’ll benefit from a city designed to accommodate growth and convenience.
10. Long-Term Real Estate Growth
Edmonton’s real estate market is poised for long-term growth, making it an excellent place to invest in a new home. As the city continues to expand and attract new residents, property values are expected to rise, ensuring a solid return on your investment.
Conclusion
Building your dream home in Edmonton is not just a financial investment—it’s a lifestyle choice. With affordable land, a thriving economy, diverse communities, and unparalleled access to nature and culture, Edmonton is a city that offers something for everyone. Whether you’re starting a family, looking to invest, or simply seeking a place that feels like home, Edmonton is the ideal destination to bring your dream home to life.
Have more questions on Edmonton Is a Great City to Build Your Dream Home 10 Reasons ? Contact Chris Reid Edmonton REALTOR®.
For more insights into Edmonton’s real estate market, follow me on Facebook, Instagram, and YouTube. Stay updated on the latest new build opportunities and exclusive deals!