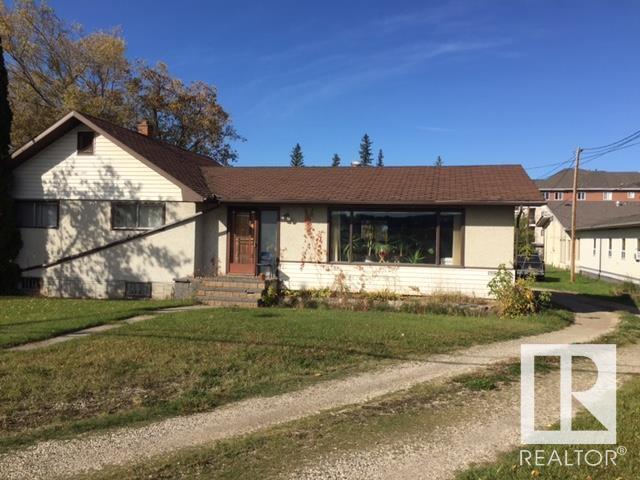
Stony Plain Real Estate Market Update: December 2025
As 2025 came to a close, the Stony Plain real estate market reflected the seasonal slowdown typical for winter but continued to showcase long-term strength. While the number of home sales fell sharply in December, both year-over-year and year-to-date figures confirm that Stony Plain remains one of Alberta’s most stable and resilient housing markets.
Even with reduced sales activity, prices held strong, days on market remained consistent, and the community continued to attract buyers seeking value, space, and proximity to Edmonton. Let’s break down what the numbers from December 2025 reveal about the state of the market and what it could mean heading into 2026.
📊 December 2025 Market Snapshot
Metric
December 2025
December 2024
% Change
Sold Properties
18
34
-47.06%
YTD Sold Properties
448
504
-11.11%
Average Asking Price
$475,000
$462,000 (est.)
+2.89%
YTD Average Asking Price
$436,000
$407,000
+7.22%
New Listings
22
26
-15.38%
YTD New Listings
582
599
-2.84%
Average Days on Market
67 days
66 days
+1.52%
YTD Days on Market
47 days
53 days
-11.32%
Average Sale Price
$349,000
$360,000 (est.)
-3.16%
YTD Average Sale Price
$404,000
$378,000
+6.89%
Ask-to-Sell Ratio
98.1%
98.2%
-0.13%
YTD Ask-to-Sell Ratio
99.0%
98.8%
+0.22%
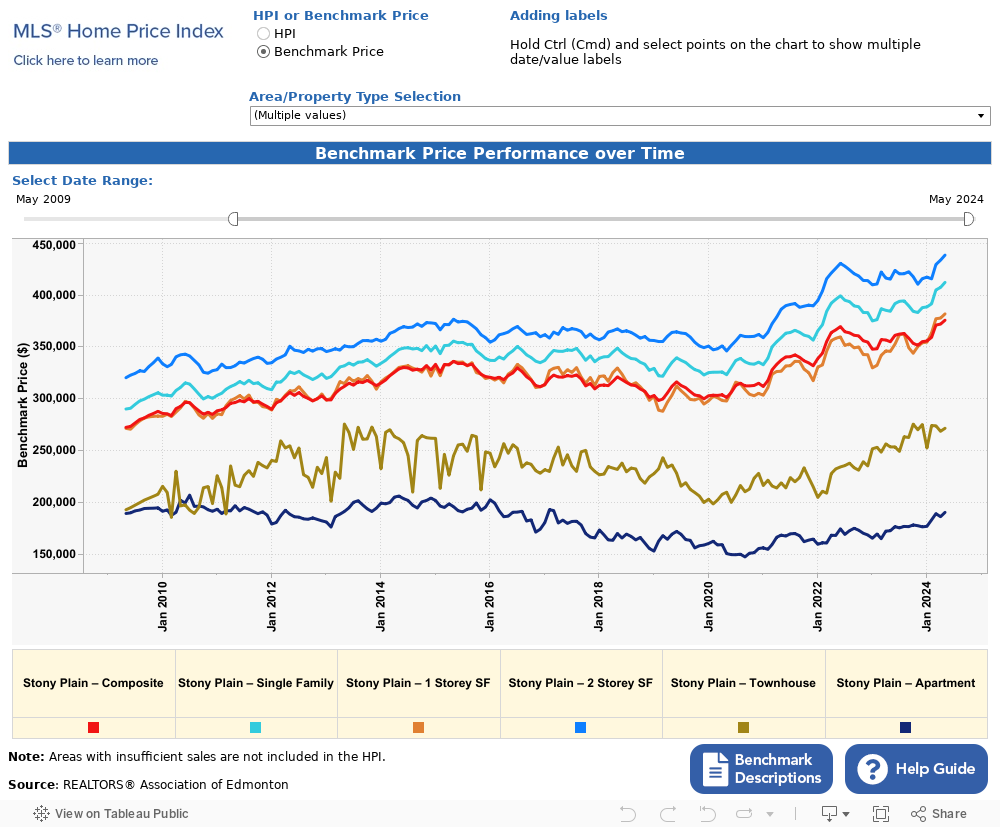
Below Graphs Are Interactive
Stony Plain Real Estate - New MLS® Listings
🔹 Fewer New Listings, Limited Inventory
In December 2025, 22 new listings were added to the market — a 15.38% decrease from last year’s 26. Overall, 582 new homes were listed in 2025, down 2.84% from 2024.
This continuing shortage of fresh inventory plays a key role in supporting prices and reducing competition among sellers. For buyers, however, it means fewer available properties to choose from, potentially leading to increased competition in early 2026 once demand rises again.
Average Asking Price of Homes in Stony Plain
🔹 Asking Prices Continue to Climb
Despite fewer sales, the average asking price rose to $475,000, up 2.89% from December 2024. Year-to-date, the average asking price reached $436,000, reflecting a 7.22% increase over last year.
Sellers continue to show confidence in the market’s strength, and rising list prices indicate optimism heading into 2026. However, with fewer active buyers during winter, properly pricing homes remains crucial to attract serious offers.
Stony Plain Home Sales
🔹 Home Sales Decline Sharply to Close the Year
December saw 18 homes sold, a steep 47.06% decrease compared to December 2024. This drop is typical for the season, as fewer buyers and sellers are active during the holidays. However, when viewed in a broader context, Stony Plain still achieved 448 total sales for the year, only 11.11% fewer than 2024 — showing that demand remained healthy overall.
This dip doesn’t necessarily indicate a market slowdown but rather a seasonal pause that’s expected to rebound early in 2026 as buyers re-enter the market after the winter lull.
Stony Plain Real Estate Market- Average Home Sale Price
🔹 Average Sale Price Dips Slightly Month-Over-Month
The average sale price in December 2025 came in at $349,000, marking a 3.16% decline compared to the same month in 2024. This pullback aligns with seasonal trends, as many late-year sales involve smaller homes, first-time buyers, or investors closing deals before year-end.
On a year-to-date basis, however, the story remains strong — the average sale price for 2025 was $404,000, up 6.89% from 2024. This reinforces that Stony Plain’s real estate market continues to appreciate steadily, offering consistent long-term value for homeowners.
🔹 Ask-to-Sell Ratio Holds Strong
The average ask-to-sell ratio — a measure of how close final sale prices come to listing prices — stood at 98.1% in December 2025, a minor 0.13% decrease from 2024. On a yearly basis, the ratio improved to 99.0%, up 0.22% from 2024. This means most homes continue to sell for very close to their asking price, highlighting a well-balanced market where sellers and buyers are largely aligned on value.
Stony Plain Average Days on Market
🔹 Days on Market Steady Despite Slower Sales
Homes in December 2025 took an average of 67 days to sell, up slightly by 1.52% compared to December 2024. That’s essentially stable, indicating that while sales volume decreased, the homes that did sell were moving at a predictable pace.
For the full year, average days on market dropped to 47 days, down 11.32% from 2024. This shows that when well-priced and marketed, homes in Stony Plain continue to attract buyers quickly, even during slower months.
🏘️ What This Means for Buyers
Winter Brings Opportunity:
With fewer active buyers, winter can be a strategic time to purchase. Sellers may be more flexible, and competition for well-priced homes is lower.
Prices Still Favourable:
Although the average sale price dipped slightly in December, annual appreciation remains solid, making Stony Plain an ideal market for long-term investment.
Inventory Is Tight:
The decline in new listings means buyers should stay proactive — having financing pre-approvals and a REALTOR® ready to act will be key in early 2026.
Interest Rate Watch:
Buyers should stay alert to rate changes in early 2026, as shifts could impact affordability and demand in the coming spring.
🏡 What This Means for Sellers
Strong Annual Price Growth:
Despite fewer transactions, the average sale price for 2025 rose nearly 7%. This sustained growth keeps sellers in a strong position moving into the new year.
Low Inventory = Higher Visibility:
With fewer homes available, listings stand out more. Well-priced and well-marketed properties are still attracting attention, even in the winter months.
Time to Strategize for Spring:
Sellers planning to list in early 2026 should use the next few weeks to prepare — fresh paint, minor upgrades, and professional staging can make a big difference when the spring market heats up.
Pricing Precision Matters:
With buyers more selective during winter, accurate pricing is crucial. Partnering with a REALTOR® who understands Stony Plain’s micro-trends can ensure you maximize value while minimizing days on market.
🌟 Why Stony Plain Remains a Desirable Market
Even with fluctuations in sales activity, Stony Plain continues to shine as one of the most balanced and promising markets in Alberta.
The town offers:
Affordability compared to Edmonton while maintaining proximity for commuters.
Community appeal with local events, schools, and amenities that attract families and retirees alike.
Consistent appreciation year after year, driven by stable demand and limited supply.
For both buyers and sellers, Stony Plain’s steady growth and balanced conditions make it one of the most sustainable real estate markets in the Edmonton region.
🔮 Looking Ahead to 2026
As we head into 2026, all signs point to another year of measured growth and strong fundamentals for Stony Plain real estate.
Expect:
Sales activity to pick up as buyers return to the market after the holidays.
Continued stability in pricing, supported by low inventory and consistent demand.
Opportunities for both buyers and sellers as the spring market begins to take shape by February and March.
While 2025 ended on a quieter note, it closed with strong year-to-date gains — setting a solid foundation for another healthy market year ahead.
Summary:
Despite fewer total transactions, 2025 ended stronger than 2024 in nearly every key metric. Home prices rose steadily, homes sold faster, and sellers continued to receive near-asking offers — all pointing to ongoing market health in Stony Plain as we move into 2026.
📞 Ready to Buy or Sell in 2026? Let’s Talk.
Whether you’re planning to buy your first home, upgrade, or sell your current property, timing your move right is everything — and that starts with the right local insight.
I’m Chris Reid, REALTOR® with Century 21 Leading, proudly helping families and investors navigate the Stony Plain and Parkland County real estate markets with confidence and data-driven strategy.
📱 Call or Text: (780) 717-5267
📧 Email: creid@chrisreidedmonton.com
Let’s make your 2026 move your most successful yet.
Data provided by the REALTORS® Association of Edmonton and subject to change. Always consult with a real estate professional for the most current market information.
If you are considering buying or selling a home in Stony Plain or just want more information on the Stony Plain real estate market, CONTACT ME HERE.
The Maison townhome by Rohit Homes is a bold designer townhome offering 1,276 square feet, 3 bedrooms, and 2.5 bathrooms in a flexible, entertainer-friendly layout. Designed with open living spaces and multiple basement options, the Maison is ideal for buyers who want modern design with long-term versatility.
Maison Townhome Overview
The Maison is designed for everyday living and entertaining, with thoughtful room placement and future-ready options.
Key specifications include:
1,276 sq ft total living space
3 bedrooms
2.5 bathrooms
Open-concept main floor
Upstairs laundry
Oversized walk-in closet in primary bedroom
Optional developed basement
Optional legal secondary suite
Main Floor Living – Designed for Entertaining
The main floor of the Maison is intentionally designed for connection. The kitchen, dining, and living areas flow seamlessly, making it easy to host guests or enjoy relaxed nights at home.
Highlights include:
Gourmet kitchen with ample counter space
Open dining and living areas
Main floor half bath tucked away for privacy
Upper Floor Comfort & Functionality
The upper floor provides a comfortable retreat for daily living.
Features include:
Spacious primary bedroom with oversized walk-in closet
Private ensuite bathroom
Two additional bedrooms, ideal for kids, guests, or a home office
Upstairs laundry, conveniently located near bedrooms
Large front and rear windows to maximize natural light
Flexible Basement Options
The Maison offers exceptional flexibility with its basement configurations.
Optional Developed Basement
Adds extra living space with:
Recreation room
Bedroom
Bathroom
Storage and mechanical space
Optional Legal Secondary Suite
A smart option for buyers seeking rental income, featuring:
One bedroom
Kitchen and dining area
Living room
Bathroom and laundry
Separate, functional layout designed for long-term use
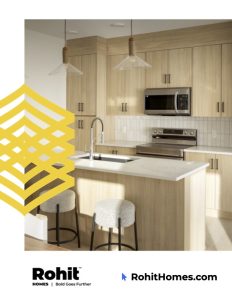
Interior Designer Packages for the Maison Townhome
The Maison townhome by Rohit Homes offers three professionally curated interior designer packages, allowing buyers to personalize their home while maintaining a cohesive, modern look throughout. Each design style is thoughtfully selected to complement the Maison’s open-concept layout and enhance both everyday living and long-term resale appeal.
Neo Interior Style
The Neo package features clean lines, modern finishes, and a minimalist aesthetic. This style emphasizes simplicity and contrast, creating a sleek, contemporary feel that pairs perfectly with the Maison’s open main floor and bright living spaces.
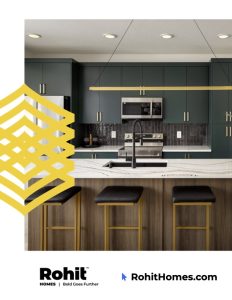
Haute Interior Style
The Haute package delivers a bold, elevated design with refined finishes and statement details. Rich tones, layered textures, and designer-inspired selections give the Maison a sophisticated look ideal for buyers who want their home to feel polished and upscale.
Zen Interior Style
The Zen package focuses on warmth, balance, and natural tones. Soft colour palettes and organic textures create a calm, inviting atmosphere that makes the Maison feel relaxed and welcoming—perfect for everyday living and entertaining.
Why buyers love Rohit’s designer packages
Professionally curated by interior designers
Eliminates overwhelming upgrade decisions
Ensures cohesive finishes throughout the home
Enhances resale appeal
Matches modern Edmonton buyer preferences
Each interior package allows the Maison townhome to feel personalized while maintaining Rohit Homes’ signature bold design standards.
Who the Maison Townhome Is Ideal For
The Maison is a great fit for:
First-time home buyers
Growing families
Buyers who love entertaining
Investors interested in legal suite options
Buyers seeking modern townhome living in Edmonton
Explore the Maison Townhome with Confidence
If you’re considering the Maison townhome by Rohit Homes, I can help you compare layouts, pricing, interior styles, and availability across Edmonton communities.
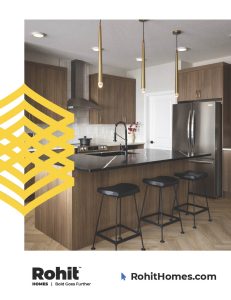
The Fen townhome by Rohit Homes is a bold designer townhome offering 1,265 square feet, 3 bedrooms, and 2.5 bathrooms in a thoughtfully planned layout. Designed for buyers who want modern style, efficient living, and the convenience of an attached garage, the Fen delivers open-concept living paired with smart private spaces.
Fen Townhome Overview
The Fen is designed to feel open, bright, and functional while maintaining a manageable footprint ideal for townhome living.
Key specifications include:
1,265 sq ft of total living space
3 bedrooms
2.5 bathrooms
Attached single garage
Open-concept main floor
Upper-floor laundry
Two private balconies (main & upper levels)
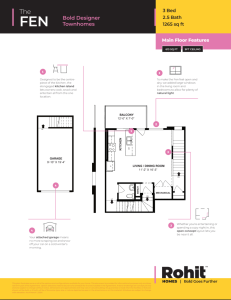
Main Floor Living – 613 sq ft with 9’ Ceilings
The main floor of the Fen townhome is designed for connection and comfort. Large windows and an open layout help the space feel airy and bright.
Main floor highlights include:
Open-concept living and dining room
Elongated kitchen island, designed as the centrepiece of the home
Kitchen positioned for entertaining and everyday use
Balcony off the main living area
Attached garage, eliminating winter scraping and adding convenience
Mechanical space discreetly tucked away
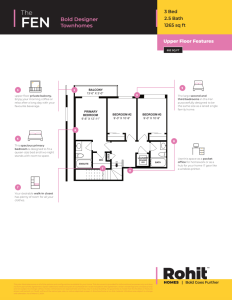
Upper Floor Layout – 652 sq ft
The upper floor of the Fen is designed to maximize comfort and usability for all occupants.
Upper floor features include:
Primary bedroom designed to fit a queen-size bed with nightstands
Walk-in closet and private ensuite in the primary bedroom
Two secondary bedrooms, purposefully designed to match the size of laned single-family bedrooms
Stacked upper-floor laundry for everyday convenience
Private upper balcony, perfect for morning coffee or relaxing after a long day
Full bathroom serving secondary bedrooms
The Cedar is available with Rohit Homes’ curated designer interior styles, allowing buyers to personalize their home without complicated upgrade decisions.
Neo Classical
The Neo Classical interior style in the Fen townhome by Rohit Homes features clean lines, modern finishes, and a minimalist design that enhances the open-concept layout and bright living spaces.
Haute Contemporary
The Haute Contemporary package showcases bold design elements, elevated finishes, and refined details that create a sophisticated, designer-inspired townhome interior.
Ethereal Zen
Ethereal Zen emphasizes warmth, balance, and natural tones, creating a calm and inviting atmosphere ideal for modern townhome living.
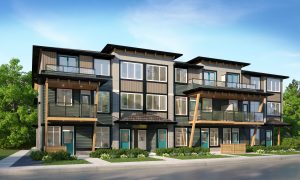
Why Buyers Choose the Fen Townhome
Attached Garage Convenience
A rare and highly desirable feature in a townhome.
Bright, Open Design
Large windows and open layouts enhance natural light throughout.
Three-Bedroom Flexibility
Ideal for families, roommates, or work-from-home needs.
Low-Maintenance Ownership
Enjoy modern living without exterior upkeep responsibilities.
Who the Fen Townhome Is Ideal For
The Fen is a great fit for:
First-time home buyers
Professionals seeking low-maintenance living
Buyers transitioning from condos
Small families or roommates
Buyers wanting an attached garage in a townhome
Explore the Fen Townhome with Confidence
If you’re considering the Fen townhome by Rohit Homes, I can help you compare layouts, pricing, interior styles, and availability across Edmonton communities.
The Cedar Stacked Townhome by Rohit Homes in Edmonton
The Cedar Townhome with Stall Parking by Rohit Homes in Edmonton
The Cedar townhome with stall parking by Rohit Homes is a modern, efficiently designed townhome created for buyers who want contemporary style, functional living space, and low-maintenance ownership. Featuring a thoughtful multi-level layout and dedicated surface parking stalls, the Cedar offers an accessible and affordable entry point into Edmonton’s new construction market.
This model is ideal for buyers who value smart design and convenience without the cost of a garage.
Cedar Townhome Overview
The Cedar townhome is designed to maximize usable living space while keeping ownership costs manageable. Its layout prioritizes open living areas, practical bedroom placement, and efficient circulation throughout the home.
Key highlights of the Cedar townhome include:
Modern townhome design
1 Bedroom
Open-concept main living area
Dedicated stall parking
Contemporary exterior architecture
Low-maintenance lifestyle
New-construction efficiency
This model offers a great balance between affordability and modern comfort.
Living & Layout
The main floor of the Cedar townhome is designed around everyday functionality. The kitchen flows naturally into the dining and living areas, creating a connected space that works well for both daily routines and entertaining.
Large windows enhance natural light, while the open layout ensures the home feels welcoming and spacious despite its efficient footprint.
Kitchen & Dining Space
The kitchen in the Cedar townhome blends modern finishes with practical design. Clean cabinetry, functional counter space, and an efficient layout make this kitchen easy to use while maintaining a sleek appearance.
Depending on the chosen interior style, the space can feel contemporary, bold, or warm — all while maintaining Rohit Homes’ consistent quality standards.
Stall Parking: Practical & Convenient
The Cedar townhome includes dedicated surface parking stalls, making ownership simpler and more affordable. This setup is ideal for buyers who prioritize function and value over a garage, while still enjoying the benefits of private parking.
Designer Interior Styles
The Cedar is available with Rohit Homes’ curated designer interior styles, allowing buyers to personalize their home without complicated upgrade decisions.
Neo Classical
The Neo Classical features clean lines, modern finishes, and a minimalist design that complements the open-concept layout and low-maintenance townhome living.
Haute Contemporary
The Haute interior style in the Cedar townhome by Rohit Homes showcases bold design elements, elevated finishes, and refined details that create a sophisticated and designer-inspired living environment.
Ethereal Zen
Ethereal Zen emphasizes warmth, balance, and natural tones, creating a calm and inviting atmosphere ideal for modern townhome living.
Each interior style enhances the townhomes modern layout while maintaining consistency and resale appeal.
Why Buyers Choose the Cedar Townhome
Affordability Without Compromise
Stall parking helps keep purchase prices accessible while maintaining modern design.
Low-Maintenance Lifestyle
Perfect for buyers who want ownership without exterior upkeep.
Smart, Functional Layout
Every square foot is thoughtfully designed for real-life living.
Who the Cedar Townhome Is Ideal For
The Cedar townhome is a great fit for:
First-time home buyers
Professionals seeking low-maintenance living
Buyers transitioning from condos
Downsizers wanting modern comfort
Buyers looking for new construction in Edmonton
Explore the Cedar Townhome with Confidence
If you’re considering the Cedar townhome with stall parking by Rohit Homes, I can help you compare layouts, pricing, interior styles, and availability across Edmonton communities.
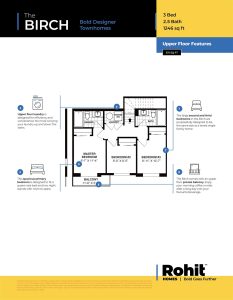
The Birch Stacked Townhome by Rohit Homes in Edmonton
The Birch stacked townhome by Rohit Homes is a bold, modern townhome designed for buyers who want space, functionality, and low-maintenance living. Offering 1,246 square feet, 3 bedrooms, and 2.5 bathrooms, the Birch delivers a thoughtful layout that lives larger than many traditional townhomes while remaining efficient and easy to maintain.
With upper-level bedrooms, private outdoor space, and smart design details, the Birch is an excellent option for first-time buyers, professionals, and downsizers in Edmonton.
Birch Stacked Townhome Overview
The Birch stacked townhome is designed to balance affordability with comfort and livability.
Key specifications include:
1,246 sq ft of total living space
Double attached garage
3 bedrooms
2.5 bathrooms
Stacked townhome configuration
Upper-floor laundry
Private balcony
Contemporary exterior design
This layout offers the feel of a traditional home with the convenience of townhome ownership.
Upper Floor Living – Smart & Functional Design
The upper floor of the Birch is where daily living truly shines. All bedrooms are located on this level, creating separation between entertaining and private spaces.
Upper floor highlights include:
Spacious primary bedroom designed to comfortably fit a queen-size bed and nightstands
Ensuite bathroom connected to the primary bedroom
Two additional bedrooms, intentionally designed to be comparable in size to single-family homes
Central upper-floor laundry, eliminating the need to carry laundry between floors
Functional full bathroom for secondary bedrooms
This layout supports families, roommates, or work-from-home flexibility.
Private Balcony – A Rare Townhome Feature
One of the standout features of the Birch stacked townhome is the upper-level private balcony.
This outdoor space is perfect for:
Morning coffee
Evening relaxation
Fresh air without yard maintenance
It adds lifestyle value that many townhomes simply don’t offer.
Designer Interior Styles: Neo, Haute & Zen
This townhome is available with Rohit Homes’ curated designer interior styles, allowing buyers to personalize their home without complicated upgrade decisions.
Neo Classical
Neo Classical – clean, modern finishes
Haute Contemporary
Haute Contemporary – bold, elevated finishes
Ethereal Zen
Ethereal Zen– features warm tones and a calm, inviting feel
Each interior style enhances the Birch’s modern layout while maintaining consistency and resale appeal.
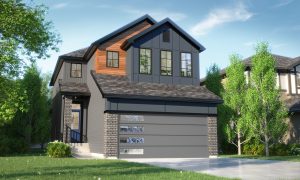
The Willow Model by Rohit Homes in Edmonton
The Willow model by Rohit Homes is a bold designer single-family home offering 1,868 square feet of thoughtfully planned living space with a double front-attached garage. Designed for families who want room to grow, the Willow features an open-concept main floor, 3 bedrooms plus a dedicated office, 2.5 bathrooms, and flexible basement development options.
This model is an excellent choice for buyers seeking a functional, modern new construction home in Edmonton.
Willow Model Overview
The Willow is designed to balance everyday functionality with comfortable family living. Its layout offers strong separation between entertaining spaces, private bedrooms, and work-from-home areas.
Key specifications include:
1,868 sq ft of total living space
3 bedrooms + office
2.5 bathrooms
Double front-attached garage
Open-concept main floor
Upper-floor bonus room
Upstairs laundry
Optional basement development or legal suite
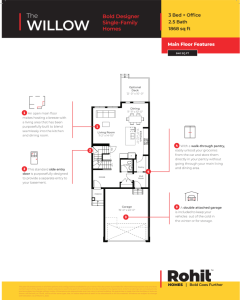
Main Floor Design & Features – 840 sq ft
The main floor of the Willow is designed to make everyday living and entertaining effortless. A spacious foyer leads into an open-concept living area where the kitchen, dining, and living spaces blend seamlessly.
Main floor highlights include:
Open-concept kitchen, dining, and living room
Walk-through pantry connecting the kitchen and mudroom
Mudroom with direct garage access
Half bath tucked away from main living areas
Standard side entrance, purposefully designed to provide separate basement access
Double front-attached garage for vehicle storage and convenience
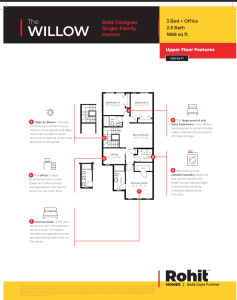
Upper Floor Layout – 1,028 sq ft
The upper level of the Willow is thoughtfully designed for comfort and everyday family routines.
Upper floor features include:
Owner’s suite with walk-in closet and ensuite
Two additional bedrooms designed to comfortably fit beds, nightstands, and storage
Dedicated office, ideal for homework or remote work
Central bonus room, perfect for a family room or media space
Side-by-side upstairs laundry, centrally located for convenience
Optional open-to-below feature to enhance natural light
Optional Basement Development – 689 sq ft
The Willow offers a flexible optional basement layout designed to expand living space or generate income.
Basement options include:
Recreation room
One or two additional bedrooms
Full bathroom
Storage and mechanical space
Legal secondary suite option for rental income potential
This makes the Willow a strong option for long-term planning or multigenerational living.
Designer Interior Styles: Neo Classical, Haute Contemporary & Ethereal Zen
The Willow model can be finished in Rohit Homes’ signature designer interior styles:
Neo Classical
Neo Classical interior style in the Willow model by Rohit Homes features clean lines, modern finishes, and a minimalist aesthetic designed to complement open-concept living spaces in this single-family home.
Haute Contemporary
Haute Contemporary interior style in the Willow model by Rohit Homes showcases bold design elements, refined finishes, and elevated details that create a sophisticated and designer-inspired living environment.
Ethereal Zen
Ethereal Zen– focuses on warmth, balance, and natural tones, creating a calm and inviting atmosphere ideal for modern family living.
Each style enhances the Willow’s open layout and modern architecture.
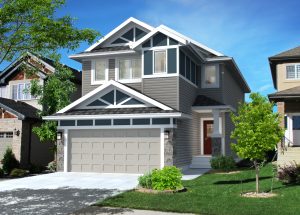
The Talo Townhome by Rohit Homes in Edmonton
The Talo townhome by Rohit Homes is a modern, thoughtfully designed townhome built for buyers who want contemporary style, efficient space, and low-maintenance living. Designed with open-concept layouts and smart room placement, the Talo townhome is an excellent choice for first-time buyers, professionals, and downsizers seeking new construction homes in Edmonton.
This townhome version of the Talo focuses on affordability, functionality, and lifestyle convenience.
Talo Townhome Overview
The Talo townhome offers a streamlined layout that maximizes usable living space while keeping maintenance and ownership costs manageable.
Key highlights of the Talo townhome include:
Modern townhome design
Open-concept main living area
Functional kitchen, dining, and living spaces
Upper-level bedrooms for privacy
Contemporary exterior elevation
Low-maintenance lifestyle
New-construction efficiency
The Talo townhome is ideal for buyers who want a modern home without the responsibilities of a larger detached property.
Main Floor Living & Layout
The main floor of the Talo townhome is designed around efficient, connected living. The kitchen opens directly into the dining and living areas, creating a cohesive space that works well for everyday routines and casual entertaining.
This open layout helps the home feel larger while remaining easy to maintain — a key advantage for townhome buyers.
Kitchen & Dining Space
The kitchen in the Talo townhome is designed for practicality and modern style. Clean cabinetry, functional counter space, and a smart layout make the kitchen easy to use while keeping the main floor visually open.
Depending on the selected interior style, the kitchen can take on a sleek, bold, or warm aesthetic while maintaining Rohit Homes’ consistent design quality.
Upper-Level Bedrooms & Comfort
Upstairs, the Talo townhome provides comfortable bedroom spaces designed for privacy and relaxation. The primary bedroom offers a quiet retreat, while additional bedrooms work well for guests, children, or a home office.
This separation of living and sleeping areas improves day-to-day comfort and livability.
Designer Interior Styles: Neo, Haute & Zen
The Talo townhome is available with Rohit Homes’ curated designer interior styles, allowing buyers to personalize their home without complicated upgrade decisions.
Neo Classical
Neo Classical – clean, modern finishes and streamlined design
Haute Contemporary
Haute Contemporary – bold, elevated finishes with designer flair
Ethereal Zen
Ethereal Zen– warm tones and balanced materials for a calm, inviting feel
Each interior style enhances the townhome’s modern layout while maintaining consistency and resale appeal.
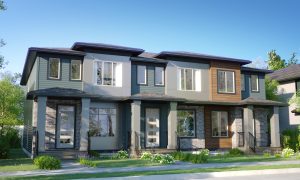
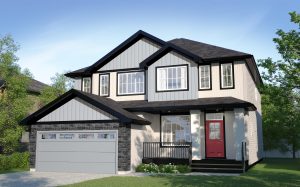
The Talo Duplex by Rohit Homes in Edmonton
The Talo duplex by Rohit Homes is a thoughtfully designed paired home offering 1,457 square feet, 3 bedrooms, and 2.5 bathrooms in a modern, efficient layout. Designed for buyers who want stylish living without unnecessary square footage, the Talo delivers open-concept design, smart storage, and flexible future options in a duplex format.
Talo Duplex Overview
The Talo is designed to maximize functionality while maintaining a cozy, welcoming feel. Its layout supports everyday living, entertaining, and long-term flexibility.
Key specifications include:
1,457 sq ft total living space
3 bedrooms
2.5 bathrooms
Open-concept main floor
Upper-level flex room
Upper-floor laundry
Optional basement development
Optional legal secondary suite
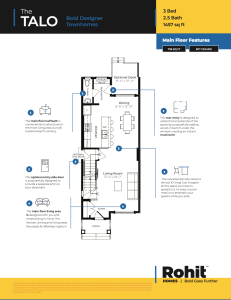
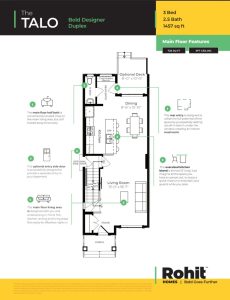
Main Floor Living – 726 sq ft
The main floor of the Talo duplex is designed with entertaining and daily life in mind. The kitchen, dining, and living areas flow seamlessly, creating a space that feels open yet functional.
Main floor highlights include:
Oversized kitchen island (nearly 10 feet long)
Open kitchen overlooking dining and living areas
Rear entry with built-in bench and coat hooks, creating an instant mudroom
Main floor half bath tucked away for privacy
Optional side entrance, purposefully designed to provide separate basement access
This layout makes the Talo especially appealing for buyers planning future basement development.
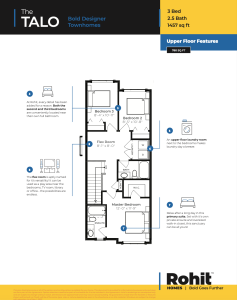
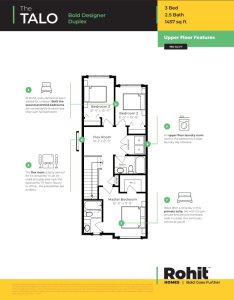
Upper Floor Layout – 780 sq ft
The upper level is designed to balance privacy and shared family space.
Upper floor features include:
Primary bedroom with private ensuite
Oversized walk-in closet in the primary suite
Two secondary bedrooms located near a full bathroom
Central flex room, ideal for a play area, TV space, library, or home office
Upper-floor laundry, conveniently located near bedrooms
This thoughtful separation makes everyday living more comfortable and efficient.
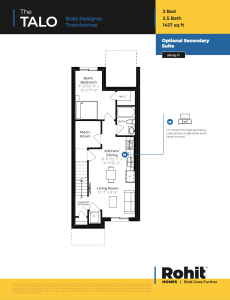
Optional Basement Development – 576 sq ft
The Talo duplex offers a well-designed optional basement that adds even more flexibility.
Basement options include:
Recreation room
Bathroom
One or two additional bedrooms
Storage and mechanical space
Legal secondary suite option for rental income potential
This makes the Talo an excellent option for multigenerational living or future income planning.
Designer Interior Styles: Neo Classical, Haute Contemporary & Ethereal Zen
The Talo model can be finished in Rohit Homes’ signature designer interior styles:
Neo Classical
Neo Classical – clean, modern finishes and streamlined design
Haute Contemporary
Haute Contemporary – bold, elevated finishes with designer flair
Ethereal Zen
Ethereal Zen– warm tones and balanced materials for a calm, inviting feel
Each style enhances the Talo’s open layout and modern architecture.
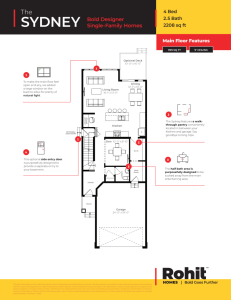
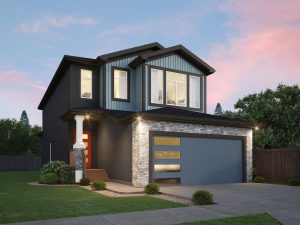
The Sydney Model by Rohit Homes in Edmonton
The Sydney model by Rohit Homes is a bold designer single-family home offering 2,208 square feet of thoughtfully planned living space. Designed for families who want flexibility, openness, and modern functionality, the Sydney combines open-concept main floor living with generous upper-level bedrooms and optional basement development.
Sydney_SF_Floorplan
With 4 bedrooms, 2.5 bathrooms, and multiple design features that support everyday living and entertaining, the Sydney is an excellent choice for buyers seeking a new construction home in Edmonton.
Sydney Model Overview
The Sydney model is designed to provide both space and versatility. Its layout balances open communal areas with private family zones, making it ideal for growing households.
Key specifications include:
2,208 sq ft total living space
4 bedrooms
2.5 bathrooms
Open-concept main floor
Dedicated den on the main level
Bonus room on the second floor
Optional basement development
Main Floor Features – 999 sq ft
The Sydney’s main floor is built for connection and comfort. The kitchen overlooks the dining and living room, creating a natural flow that’s perfect for entertaining and everyday family life.
Main floor highlights include:
Open-concept kitchen, dining, and living areas
Spacious den, ideal for a home office or flex space
Walk-through pantry connecting the kitchen and garage
Half bath tucked away from entertaining areas
Large rear window for added natural light
Optional side entrance, ideal for future basement development
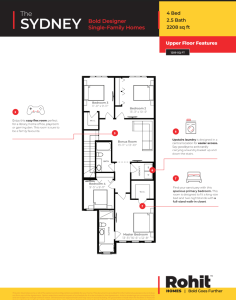
Upper Floor Features – 1,209 sq ft
The second floor of the Sydney is designed with family comfort in mind, keeping bedrooms and shared spaces thoughtfully arranged.
Upper-level features include:
Primary bedroom designed to accommodate a king-size bed
Walk-in closet in the primary suite
Ensuite bathroom
Three additional bedrooms
Central bonus room, ideal for a playroom or media space
Upstairs laundry for added convenience
This layout keeps daily routines efficient while providing separation between sleeping and living spaces.
Optional Basement Development – 781 sq ft
The Sydney offers an optional basement development that adds even more flexibility to the home.
Basement features include:
Additional bedrooms
Full bathroom
Recreation room
Storage and mechanical space
This option is ideal for extended family living, guests, or future flexibility.
Optional Basement Development (768 sq ft)
The Sicily offers a thoughtfully designed optional basement development, adding even more flexibility for growing families or buyers planning ahead.
Basement options include:
Additional bedrooms
Full bathroom
Recreation room
Storage areas
Legal secondary suite option for rental income potential
This makes the Sicily particularly appealing to buyers considering future income generation or extended family living.
Designer Interior Styles: Neo Classical, Haute Contemporary & Ethereal Zen
The Sydney model can be finished in Rohit Homes’ signature designer interior styles:
Neo Classical
Neo Classical – clean, modern finishes and streamlined design
Haute Contemporary
Haute Contemporary – bold, elevated finishes with designer flair
Ethereal Zen
Ethereal Zen– warm tones and balanced materials for a calm, inviting feel
Each style enhances the Sydney’s open layout and modern architecture.
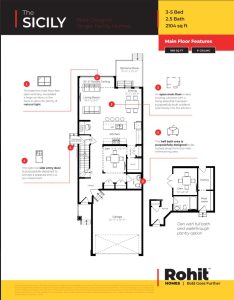
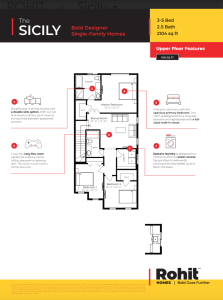
The Sicily Model by Rohit Homes in Edmonton
The Sicily model by Rohit Homes is a bold, designer single-family home offering 2,104 square feet of thoughtfully designed living space. Built for families who want flexibility, space, and modern functionality, the Sicily combines open-concept living with smart separation between entertaining areas and private spaces.
With 3–5 bedrooms, 2.5 bathrooms, and multiple configuration options, the Sicily is one of Rohit Homes’ most adaptable single-family floor plans for buyers building or purchasing a new home in Edmonton.
Sicily Model Overview
The Sicily is designed to grow with your lifestyle. Its layout allows buyers to prioritize entertaining, multigenerational living, or future rental income through optional configurations.
Key specifications of the Sicily model include:
2,104 sq ft of total living space
3–5 bedrooms (depending on options)
2.5 bathrooms
Open-concept main floor
Bonus room on the second floor
Second-floor laundry
Optional basement development or legal secondary suite
This flexibility makes the Sicily especially attractive to families planning long-term homeownership.
Main Floor Design & Features (999 sq ft)
The Sicily’s open-concept main floor is intentionally designed for entertaining while maintaining functionality for everyday life. The living room flows seamlessly into the kitchen and dining area, creating a connected space that feels open and welcoming.
Main floor highlights include:
Open living area blending kitchen, dining, and living spaces
Raised kitchen ceiling for added openness
Large rear window for enhanced natural light
Half bath discreetly tucked away from entertaining areas
Walk-in pantry
Pocket office option
Optional side entrance, ideal for future basement development
Buyers can also choose to replace the den with a main-floor bedroom suite or spice kitchen, making the Sicily well-suited for multigenerational households.
Second Floor Layout (1,105 sq ft)
The second floor of the Sicily is designed to separate private spaces from shared family areas, improving comfort and livability.
Upper-level features include:
Spacious primary bedroom designed to accommodate a king-size bed
Full-size walk-in closet in the primary suite
Ensuite with double sink option and tub/shower combination
Two additional bedrooms
Central bonus room, perfect for a playroom, office, or media space
Second-floor laundry, centrally located for convenience
This layout minimizes noise transfer and keeps bedrooms comfortably separated from shared living zones.
Optional Basement Development (768 sq ft)
The Sicily offers a thoughtfully designed optional basement development, adding even more flexibility for growing families or buyers planning ahead.
Basement options include:
Additional bedrooms
Full bathroom
Recreation room
Storage areas
Legal secondary suite option for rental income potential
This makes the Sicily particularly appealing to buyers considering future income generation or extended family living.
Designer Interior Styles: Neo Classical, Haute Contemporary & Ethereal Zen
Like other Rohit Homes models, the Sicily can be finished in one of three curated designer interior styles, allowing buyers to personalize their home while maintaining cohesive design.
Neo Classical
Neo Classical – clean, modern lines and contemporary finishes
Haute Contemporary
Haute Contemporary – bold, elevated design with refined details
Ethereal Zen
Ethereal Zen– warm tones and balanced materials for a calm, inviting feel
Each style complements the Sicily’s open layout and enhances the home’s natural light and flow.