
Edmonton Detached Single Family Home Market: June 2026 Update


Interactive bar graphs
Edmonton New Single Family Home Listings
🆕 New Listings Continue to Increase
Inventory growth remains a key theme in 2026.
There were 1,730 new detached home listings in June, an increase of 1.83% year-over-year. Year-to-date, Edmonton has recorded 8,760 new listings, up 2.34% from 2025.
More listings mean buyers have:
✅ More choice
✅ Less urgency
✅ Greater negotiating power
For sellers, increased inventory means presentation and pricing are becoming increasingly important.
Average Asking Price
🏷️ Seller Confidence Remains Strong
The average asking price reached $622,000 in June, up 2.44% from last year. Sellers continue to show confidence in the Edmonton market, supported by stable pricing trends and ongoing demand.
Year-to-date, the average asking price is now $625,000, up 1.25% over 2025.
This demonstrates that sellers are not feeling pressure to discount significantly, although proper pricing remains essential in a more competitive environment.
🏘️ Sales Activity Nearly Matches Last Year
June saw 1,020 detached homes sold, representing only a 1.06% decrease compared to June 2025. This is one of the strongest year-over-year sales performances we've seen so far in 2026 and suggests that buyer activity is beginning to stabilize.
While year-to-date sales remain down 11.91%, the narrowing gap compared to previous months indicates that buyers are becoming more active as they adjust to current market conditions.
The Edmonton market appears to be finding its footing after a slower start to the year.
Average Single Family Home Sale Price
💰 Average Sale Prices Continue to Rise
One of the strongest indicators in the June report is continued price appreciation.
The average detached home sold for $573,000 in June, an increase of 2.87% compared to June 2025. This demonstrates that buyer demand remains strong enough to support home values despite longer selling times and increased inventory.
Year-to-date, the average sale price has climbed to $571,000, representing a 1.80% increase over 2025.
For homeowners, this is encouraging news. Edmonton continues to see steady appreciation without the volatility experienced in many other Canadian markets.
💬 Ask-to-Sell Ratio Indicates More Negotiation
The average ask-to-sell ratio declined slightly to 0.984, meaning detached homes sold for approximately 98.4% of their asking price in June.
While still a healthy number, it confirms that buyers have regained some negotiating leverage compared to the highly competitive conditions of recent years.
Today's buyers are more selective and willing to negotiate when they see opportunities.
Days on MLS®
⏳ Days on Market Remain Elevated
Homes took an average of 52 days to sell in June, compared to 41 days in June 2025, a significant 26.83% increase.
Year-to-date, detached homes are averaging 60 days on market, compared to 47 days last year.
This trend reflects a more balanced market where buyers have time to compare options before making decisions.
For sellers, patience and proper preparation are increasingly important.
📈 Edmonton Detached Homes YTD Comparison (2026 vs 2025)
| Metric | 2026 YTD | 2025 YTD | % Change |
| Sold Properties | 4,550 | 5,170 | ▼ 11.91% |
| Average Asking Price | $625,000 | $617,000 | ▲ 1.25% |
| Average Sale Price | $571,000 | $561,000 | ▲ 1.80% |
| New Listings | 8,760 | 8,560 | ▲ 2.34% |
| Days on Market | 60 | 47 | ▲ 27.66% |
| Ask-to-Sell Ratio | 0.986 | 0.998 | ▼ 1.24% |
📊 What the June Numbers Tell Us
The June market paints a picture of a healthy, balanced housing market:
Positive Signs
✔ Home prices continue to rise
✔ Sales activity is stabilizing
✔ Inventory growth remains manageable
✔ Buyer demand remains strong
Market Shifts
✔ Homes are taking longer to sell
✔ Buyers have more options
✔ Negotiations are becoming more common
✔ Sellers need stronger marketing strategies
Overall, Edmonton continues to avoid the dramatic swings seen in many larger Canadian markets.
🧠 What This Means for Buyers
The current market presents excellent opportunities for buyers.
Advantages
- More inventory available
- Less competition than 2025
- More negotiating flexibility
- Stable price growth
Considerations
- Desirable homes still sell quickly
- Mortgage qualification remains important
- Interest rates continue to influence affordability
For many buyers, 2026 may offer one of the best opportunities in recent years to purchase a detached home without competing in multiple-offer situations.
💼 What This Means for Sellers
Sellers continue to benefit from rising home values, but strategy matters more than ever.
The most successful listings are:
- Priced appropriately
- Professionally marketed
- Well staged
- Move-in ready
While the market remains favourable, buyers are taking longer to make decisions and are more willing to negotiate.
🔮 Looking Ahead to Summer 2026
Heading into July and August, several trends will be important to watch:
- Whether sales continue to close the gap with 2025
- Inventory levels through the summer
- Price appreciation trends
- Interest rate decisions
If current patterns continue, Edmonton should remain one of Canada's strongest and most balanced detached housing markets.
📞 Ready to Buy or Sell in Edmonton?
Whether you're looking to purchase your first home, upgrade to a larger property, or sell your current home, understanding today's market is the first step to success.
📱 Call or text Chris Reid at 780-717-5267
🌐 Visit chrisreidedmonton.com
Let's create a strategy that helps you achieve your real estate goals in 2026.
Data provided by the REALTORS® Association of Edmonton and subject to change. Always consult with a real estate professional for the most current market information.
If you would like more information on buying and selling single family homes in Edmonton CONTACT CHRIS REID
City of Edmonton Website

Parkland County Acreage Market Overview: June 2026
The Parkland County acreage market gained momentum in June 2026, delivering encouraging news for both buyers and sellers. Sales activity increased, prices strengthened, and properties sold significantly faster than they did a year ago. While year-to-date sales remain below the record pace set in 2025, the June numbers suggest that the acreage market is finding its footing and moving toward a more balanced and sustainable environment.
Whether you're looking to buy a hobby farm, country residential property, equestrian acreage, or luxury rural estate, understanding the latest market trends can help you make informed decisions.
📞 Thinking about buying or selling an acreage? Call Chris Reid at (780) 717-5267 for expert advice on the Parkland County acreage market.
📊 June 2026 Market Snapshot
According to the June 2026 Parkland County Acreage Market Update :
- 53 properties sold (↑ 12.77% year-over-year)
- 74 new listings (↑ 15.63%)
- Average asking price: $985K (↑ 10.65%)
- Average sale price: $765K (↑ 11.36%)
- Days on market: 38 days (↓ 26.92%)
- Ask-to-sell ratio: 0.987 (↓ 0.12%)
These numbers paint a picture of a market that is becoming more competitive, with buyers acting quickly and sellers benefiting from rising prices.


Below Graphs Are Interactive
Parkland County Acreage Listings
📦 Inventory Levels Continue to Tighten
📦 Inventory Improves but Remains Below Last Year
June saw 74 new acreage listings, an increase of 15.63% compared to June 2025.
While inventory improved this month, year-to-date listings remain lower:
| New Listings YTD |
| 2026: 340 |
| 2025: 406 |
| Change: ↓ 16.26% |
What This Means
For buyers:
- More choice than earlier in the year
- Better opportunity to compare properties
For sellers:
- Increased competition from new listings
- Strategic pricing and professional marketing remain critical
Despite June's increase, inventory remains well below historical norms.
Average List Price
📈 Asking Prices Near the Million-Dollar Mark
The average asking price reached $985,000 in June, representing a 10.65% increase year-over-year.
Year-to-date:
| Average Asking Price |
| 2026: $948K |
| 2025: $897K |
| Change: ↑ 5.73% |
Sellers continue to show confidence in the long-term value of acreage properties throughout Parkland County.
Communities near Spruce Grove, Stony Plain, Muir Lake, Spring Lake, and Glory Hills continue to attract strong buyer interest due to their convenient access to Edmonton while offering the privacy and space many families desire.
Parkland County Acreage Sales
🏡 Sales Activity Rebounds in June
One of the most encouraging statistics from June is the increase in sales activity.
A total of 53 acreage properties sold, representing a 12.77% increase compared to June 2025.
This marks a significant improvement over the slower start to the year and suggests that buyers are returning to the market as summer arrives.
However, looking at the broader picture:
| Sold Properties YTD |
| 2026: 176 |
| 2025: 236 |
| Change: ↓ 25.42% |
While year-to-date sales remain below last year's pace, June's strong performance indicates that buyer confidence may be returning.
What This Means
- Buyers remain interested in rural living.
- Demand for acreage properties remains healthy.
- The market is showing signs of stabilization after a slower winter and spring.
Parkland County Average Sale Price
💰 Acreage Prices Continue to Rise
June brought positive news for property values.
The average sale price increased to $765,000, an 11.36% increase from June 2025.
Year-to-date, the average sale price sits at:
| Average Sale Price |
| 2026: $770K |
| 2025: $759K |
| Change: ↑ 1.41% |
This continued growth demonstrates that buyers are still willing to pay strong prices for desirable acreage properties.
Why Prices Are Holding Strong
Several factors continue to support acreage values:
- Limited inventory compared to previous years
- Strong demand for rural lifestyles
- Continued population growth in the Edmonton region
- Increased interest in multi-generational and hobby farm properties
- 🔥 Buyers Continue Paying Near Asking Price
The ask-to-sell ratio remained exceptionally strong at 0.987, meaning sellers received approximately 98.7% of their asking price on average.
Year-to-date:
Ask-to-Sell Ratio 2026: 0.986 2025: 0.985 Change: ↑ 0.03% This statistic reinforces the fact that properly priced properties continue to perform well.
Buyers are negotiating, but not dramatically.
Average Days on MLS®
⏱️ Homes Are Selling Faster
Perhaps the most impressive statistic from June is the reduction in time on market.
Properties sold in an average of just 38 days, a 26.92% decrease compared to June 2025.
Year-to-date:
| Days on Market |
| 2026: 63 |
| 2025: 67 |
| Change: ↓ 5.97% |
What This Means
Buyers are making decisions more quickly, especially when properties are:
- Properly priced
- Well maintained
- Located near major commuter routes
- Equipped with desirable features such as shops, barns, and updated homes
For sellers, this means that preparation before listing is more important than ever.
📊 Year-to-Date Comparison (January–June)
| Metric | 2026 YTD | 2025 YTD | % Change |
| Sold Properties | 176 | 236 | ↓ 25.42% |
| New Listings | 340 | 406 | ↓ 16.26% |
| Average Asking Price | $948K | $897K | ↑ 5.73% |
| Average Sale Price | $770K | $759K | ↑ 1.41% |
| Days on Market | 63 | 67 | ↓ 5.97% |
| Ask-to-Sell Ratio | 0.986 | 0.985 | ↑ 0.03% |
(Source: June 2026 Parkland County Acreage Market Update)
🧭 What This Means for Buyers
If you're shopping for an acreage this summer:
✅ Inventory has improved from earlier this year.
✅ Properties are selling faster.
✅ Prices continue to rise modestly.
✅ Competition remains strongest for move-in-ready properties.
Working with a REALTOR® who understands rural properties can help you move quickly when the right opportunity appears.
🏡 What This Means for Sellers
June's numbers provide several reasons for optimism:
✅ Sales increased year-over-year.
✅ Average sale prices climbed more than 11%.
✅ Homes sold significantly faster.
✅ Buyers continue paying close to asking price.
If you've been considering selling, the summer market remains favourable.
🌾 Final Thoughts
The June 2026 Parkland County acreage market showed clear signs of strength:
✔️ Higher sales activity
✔️ Rising property values
✔️ Faster selling times
✔️ Strong buyer demand
Although year-to-date sales remain below 2025 levels, June demonstrates that the acreage market continues to attract serious buyers who value the lifestyle, space, and opportunities that rural living provides.
As we move into the second half of 2026, Parkland County remains one of the most desirable acreage markets in the Edmonton region.
📞 Let's Talk Parkland County Acreages
Whether you're looking to buy, sell, or simply learn what your acreage is worth:
Chris Reid
Century 21 Leading
📱 (780) 717-5267
📧 creid@chrisreidedmonton.com
Specializing in Parkland County acreages, rural homes, hobby farms, equestrian properties, and country residential real estate.
Data provided by the REALTORS® Association of Edmonton and subject to change. Always consult with a real estate professional for the most current market information.
If you would like more information on buying and selling in Parkland County CONTACT CHRIS REID
Edmonton Real Estate Market Update – June 2026
The Edmonton real estate market continued its transition toward balanced conditions in June 2026. While sales activity remained below the exceptional pace experienced in 2025, home values continued to climb, inventory levels expanded, and buyers benefited from increased choice throughout the market.
The June statistics reveal a market that remains healthy despite slower transaction volume. Price appreciation, steady listing activity, and strong overall demand continue to support Edmonton's reputation as one of Canada's most affordable and resilient major housing markets.
Whether you're buying, selling, investing, or considering new construction, understanding these trends can help you make informed decisions during the busy summer market.
All statistics below are sourced from the REALTORS® Association of Edmonton June 2026 Market Report.
📊 Edmonton Market Snapshot – June 2026
Here are the key residential market statistics for June:
- Sold Properties: 1,830
- Average Asking Price: $482,000
- Average Sale Price: $457,000
- New Listings: 3,310
- Days on Market: 57 Days
- Ask-to-Sell Ratio: 97.9%


Below Graphs Are Interactive.
Edmonton New MLS® Listings
📈 New Listings Continue to Grow
Inventory remains one of the biggest stories in the Edmonton market.
June saw 3,310 new listings, representing a 4.32% increase year-over-year. Year-to-date, new listings have reached 17,000 properties, up 2.72% compared to 2025.
This growing inventory benefits buyers by providing:
- More selection
- Less competition
- Additional negotiating opportunities
For sellers, increased inventory means standing out from the competition is becoming increasingly important.
Average List Price Edmonton Real Estate Market
🏷️ Average Asking Prices Remain Stable
The average asking price in June was $482,000, up 1.02% from June 2025.
Year-to-date, average asking prices sit at $483,000, compared to $477,000 in 2025, representing a 1.20% increase.
This relatively modest increase compared to sale prices suggests sellers are pricing homes more realistically.
Today's market rewards:
- Accurate pricing
- Professional marketing
- Strong presentation
Properties priced appropriately continue to attract attention and sell successfully.
Home Sales In The Edmonton Real Estate Market
🏡 Home Sales: Activity Improves from Spring Levels
A total of 1,830 homes sold in June 2026, representing a 7.47% decrease compared to June 2025. While sales remain below last year's pace, June showed a significant improvement from the slower winter months.
The sales gap between 2026 and 2025 continues to narrow. Earlier in the year, January and February recorded declines exceeding 20%, whereas June's decrease was much smaller.
This suggests:
- Buyer confidence is improving
- Summer demand remains healthy
- The market is stabilizing after the rapid pace seen in 2025
The chart included in the June report also shows a steady increase in sales activity throughout the first half of 2026, reflecting typical seasonal patterns.
Edmonton Average Home Sale Price
💰 Average Sale Prices Continue to Rise
One of the strongest indicators of Edmonton's market health remains price appreciation.
The average sale price reached $457,000 in June, a 4.57% increase year-over-year. Year-to-date, Edmonton's average sale price now sits at $452,000, representing a 3.61% increase compared to 2025.
This continued growth demonstrates that:
- Demand remains healthy
- Buyers are willing to pay for quality properties
- Edmonton housing values continue appreciating at a sustainable pace
Unlike many Canadian markets that have experienced dramatic swings, Edmonton continues to benefit from steady and predictable growth.
📉 Ask-to-Sell Ratio: Negotiation Remains Part of the Process
The average ask-to-sell ratio in June was 0.979, meaning homes sold for approximately 97.9% of asking price.
Year-to-date, the ratio sits at 0.980, compared to 0.992 last year.
This reflects:
- Increased negotiation opportunities
- More balanced conditions
- Greater buyer leverage than in previous years
However, sellers are still achieving very close to their asking prices when homes are properly priced.
Edmonton Real Estate Market -Average Days
⏳ Days on Market: Longer Selling Timelines Continue
Homes took an average of 57 days to sell in June, an increase of 29.55% compared to June 2025.
Year-to-date, homes are averaging 65 days on market, compared to 48 days during the same period in 2025.
While homes are taking longer to sell, this does not indicate a weak market.
Instead, buyers are:
- Taking more time to compare properties
- Negotiating more frequently
- Making more informed decisions
This is a characteristic of a balanced market rather than an overheated one.
📊 Year-to-Date Comparison (2026 vs 2025)
| Metric | 2026 YTD | 2025 YTD | % Change |
| Sold Properties | 8,480 | 10,100 | ↓ 15.74% |
| Average Asking Price | $483,000 | $477,000 | ↑ 1.20% |
| Average Sale Price | $452,000 | $436,000 | ↑ 3.61% |
| New Listings | 17,000 | 16,500 | ↑ 2.72% |
| Days on Market | 65 | 48 | ↑ 35.42% |
| Ask-to-Sell Ratio | 0.980 | 0.992 | ↓ 1.23% |
🧠 What This Means for Buyers
If you're buying in Edmonton today, conditions remain favourable.
Buyers benefit from:
✔️ More inventory
✔️ More time to evaluate options
✔️ Less competition than 2025
✔️ Increased negotiating opportunities
However, prices continue to rise.
Waiting may provide additional options, but it may also mean paying more later if price appreciation continues.
🏠 What This Means for Sellers
Sellers still have strong opportunities in today's market.
Homes that perform best are:
- Professionally marketed
- Priced accurately
- Well maintained
- Properly staged
The days of simply listing a property and expecting multiple offers immediately have largely passed, but motivated buyers remain active.
📈 Edmonton Market Outlook for Summer 2026
The second half of 2026 is shaping up to be active.
Several factors continue supporting the market:
- Interprovincial migration into Alberta
- Relative affordability compared to other provinces
- Stable economic conditions
- Strong population growth
Expect:
- Continued moderate price appreciation
- Stable inventory levels
- Healthy buyer demand
- Balanced market conditions
🎯 Final Thoughts
June 2026 reinforces the trend we've seen all year:
Edmonton is becoming a more balanced market.
Sales remain lower than the extraordinary pace of 2025, but prices continue rising, inventory is expanding, and buyers have more options.
This creates opportunities on both sides of the transaction.
For buyers, there is greater choice and negotiating power.
For sellers, strong pricing and preparation remain the keys to success.
Overall, Edmonton continues to be one of Canada's strongest long-term real estate markets.
📞 Let's Talk Real Estate
If you're considering buying, selling, investing, or exploring new construction opportunities in Edmonton, I'd love to help.
📞 Call or Text Chris Reid at (780) 717-5267
Century 21 Leading
Serving Edmonton and the Greater Edmonton Area
Data provided by the REALTORS® Association of Edmonton and subject to change. Always consult with a real estate professional for the most current market information.
Looking to buy or sell in Edmonton? CONTACT CHRIS REID
City of Edmonton Website
Spruce Grove Real Estate Market Update June 2026
The summer real estate season has officially arrived, and the Spruce Grove housing market is showing encouraging signs of activity. June brought increases in sales, listings, and sale prices compared to the same month last year, suggesting buyers are becoming more active as they adjust to current market conditions.
At the same time, homes are taking longer to sell, and buyers continue to enjoy more negotiating power than they did during the highly competitive markets of 2024 and early 2025. For both buyers and sellers, June's numbers highlight a market that is active, balanced, and full of opportunity.
📊 June 2026 Market Snapshot
According to the June 2026 Spruce Grove Local Market Update:
- 113 homes sold (↑ 3.67% year-over-year)
- 176 new listings (↑ 21.38%)
- Average sale price: $495,000 (↑ 1.11%)
- Average asking price: $500,000 (↑ 3.57%)
- Days on market: 63 days (↑ 61.54%)
- Ask-to-sell ratio: 0.992
Year-to-Date (January – June 2026)
- 563 homes sold (↓ 6.79%)
- 905 new listings (↑ 3.67%)
- Average sale price: $476,000 (↓ 0.79%)
- Average asking price: $502,000 (↓ 0.47%)
- Days on market: 65 days (↑ 35.42%)
- Ask-to-sell ratio: 0.991
Source: June 2026 Spruce Grove Local Market Update.


The below graphs are interactive
New MLS® Listing Count
📦 New Listings: Inventory Expands Significantly
One of the biggest stories in June was inventory growth.
A total of 176 new listings came to market during June 2026, an impressive 21.38% increase compared to June 2025. This pushed year-to-date listings to 905 properties, up 3.67% from last year.
More inventory creates opportunity for buyers while also increasing competition among sellers.
For buyers, this means:
- More choice
- Less urgency
- Better opportunities to compare homes
For sellers, it means:
- Strategic pricing matters
- Professional marketing is essential
- Homes must stand out from competing listings
Average Listing Price in Spruce Grove
💰 Average Asking Price: Sellers Remain Confident
The average asking price in June 2026 was $500,000, representing a 3.57% increase from June 2025.
This monthly increase shows that sellers remain optimistic about Spruce Grove's long-term value. However, when looking at the broader picture, the year-to-date average asking price is $502,000, which is virtually unchanged from last year and actually sits 0.47% below the 2025 average.
The market appears to have found a pricing equilibrium after several years of significant appreciation.
Spruce Grove Home Sales
🏠 Sales Activity: Summer Momentum Builds
June brought positive news for Spruce Grove sellers, with 113 homes sold, representing a 3.67% increase compared to June 2025. This marks the second consecutive month where sales activity has shown signs of improvement, suggesting buyers are becoming more comfortable making purchasing decisions despite ongoing economic uncertainty.
While year-to-date sales remain below last year's pace, the gap continues to narrow. Through the first six months of 2026, 563 homes have sold, compared to 604 during the same period in 2025, a decrease of 6.79%.
This tells us the market isn't slowing—it is normalizing.
Real Estate Market Statistics Spruce Grove Average Home Sale Price
📈 Average Sale Price: Positive Momentum Continues
The average sale price climbed to $495,000 in June, up 1.11% from June 2025.
This is an encouraging sign for homeowners, as it demonstrates that despite increased inventory and longer selling times, buyers remain willing to pay strong prices for well-presented homes.
Year-to-date, the average sale price sits at $476,000, down only 0.79% from 2025. Considering the substantial gains Spruce Grove experienced over the previous few years, this level of price stability is actually a sign of a healthy market.
⚖️ Ask-to-Sell Ratio: A Balanced Market Emerges
The average ask-to-sell ratio in June was 0.992, meaning homes sold for approximately 99.2% of their asking price.
While slightly lower than last year's ratio, this still indicates a healthy market where sellers are achieving very close to their list prices.
Year-to-date, the ratio sits at 0.991, compared to 1.003 in 2025.
The takeaway?
Buyers have regained some negotiating power, but properly priced homes are still commanding strong offers.
Days on Market Until Sale
⏳ Days on Market: Buyers Continue Taking Their Time
Perhaps the most notable trend in the June report is the increase in marketing time.
Homes sold in an average of 63 days, compared to just 39 days in June 2025, representing a 61.54% increase.
Year-to-date, homes are taking an average of 65 days to sell, compared to 48 days during the same period last year.
This shift reflects:
- More inventory available
- Less competition among buyers
- Increased buyer caution
- Greater willingness to negotiate
The days of listing a home on Thursday and receiving multiple offers by Sunday are becoming less common.
📊 Year-to-Date Comparison: 2026 vs. 2025
| Metric | 2026 YTD | 2025 YTD | % Change |
| Sold Properties | 563 | 604 | ↓ 6.79% |
| Average Asking Price | $502,000 | $504,000 | ↓ 0.47% |
| Average Sale Price | $476,000 | $479,000 | ↓ 0.79% |
| New Listings | 905 | 873 | ↑ 3.67% |
| Days on Market | 65 | 48 | ↑ 35.42% |
| Ask-to-Sell Ratio | 0.991 | 1.003 | ↓ 1.28% |
Source: June 2026 Spruce Grove Local Market Update.
🏡 What This Means for Buyers
If you're looking to buy in Spruce Grove, today's market offers advantages that simply weren't available a year ago.
Buyer Advantages
✔ More listings available
✔ More time to evaluate properties
✔ Increased negotiating opportunities
✔ Stable pricing environment
The market remains competitive for desirable homes, but buyers now have breathing room to make informed decisions.
💡 What This Means for Sellers
Sellers can still achieve excellent results—but strategy is more important than ever.
Seller Success Tips
✔ Price accurately from day one
✔ Invest in professional photography
✔ Stage your home where possible
✔ Expect negotiations
✔ Work with a REALTOR® who understands current conditions
The good news is that prices remain strong, and sales activity is improving.
🏗️ New Construction Market Update – June 2026 vs. June 2025
If you send over the June 2025 and June 2026 new construction statistics (similar to what you provided for March, April, and May), I can add a detailed builder/new construction section that matches the style of your previous blogs.
🌇 Why Spruce Grove Continues to Grow
Spruce Grove remains one of the most desirable communities in the Edmonton region because of its:
- Family-friendly neighbourhoods
- Excellent schools
- Growing retail and commercial amenities
- Easy access to Edmonton
- Strong value compared to many Edmonton communities
Neighbourhoods like Greenbury, Prescott, Jesperdale, Harvest Ridge, Fenwyck, and McLaughlin continue to attract buyers seeking space, amenities, and long-term value.
📞 Thinking About Buying or Selling in Spruce Grove?
Whether you're buying your first home, upgrading, downsizing, or investing, understanding local market trends can help you make better decisions.
I'd love to help you navigate the Spruce Grove market.
📱 Christina Reid, REALTOR®
📞 (780) 717-5267
📧 creid@chrisreidedmonton.com
🌐 chrisreidedmonton.com
Data provided by the REALTORS® Association of Edmonton and subject to change. Always consult with a real estate professional for the most current market information.


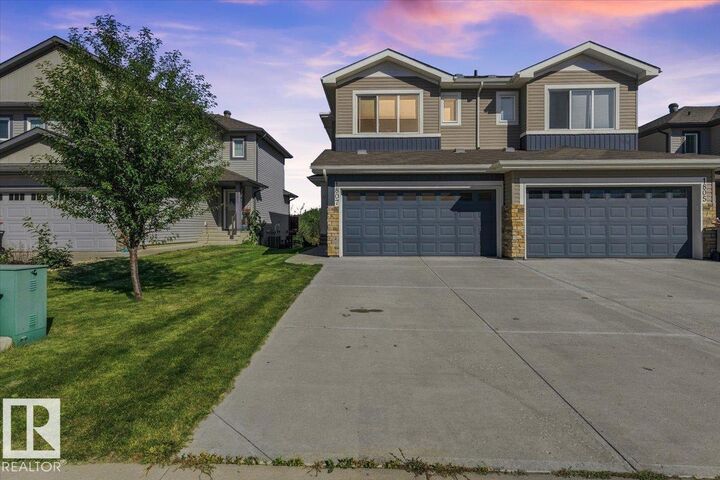
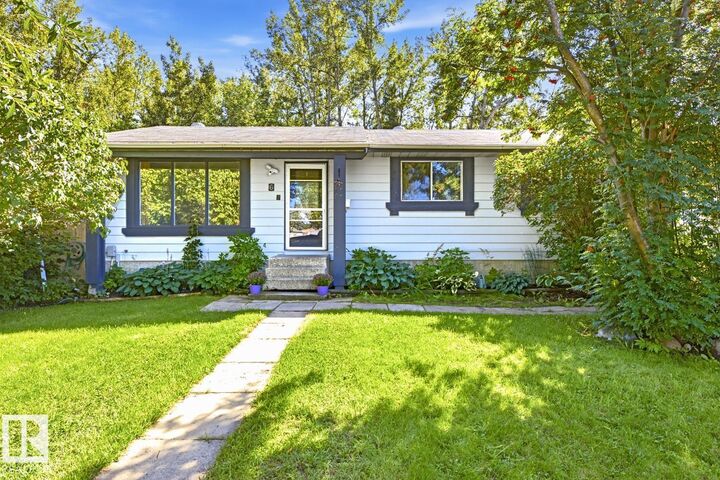

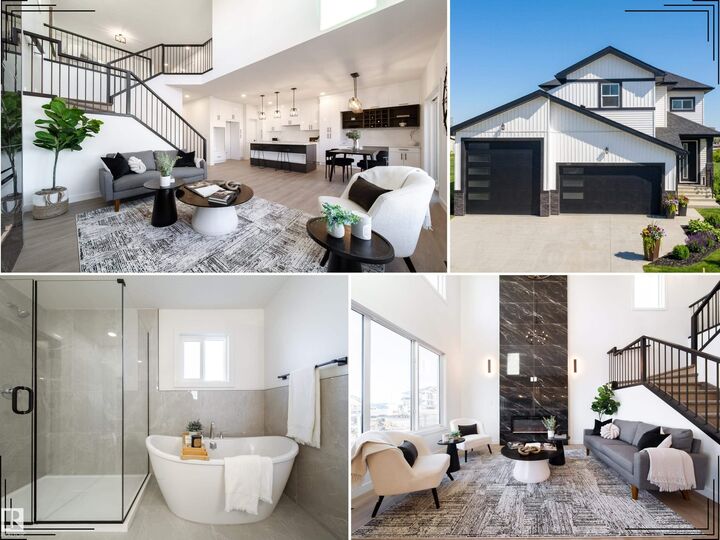
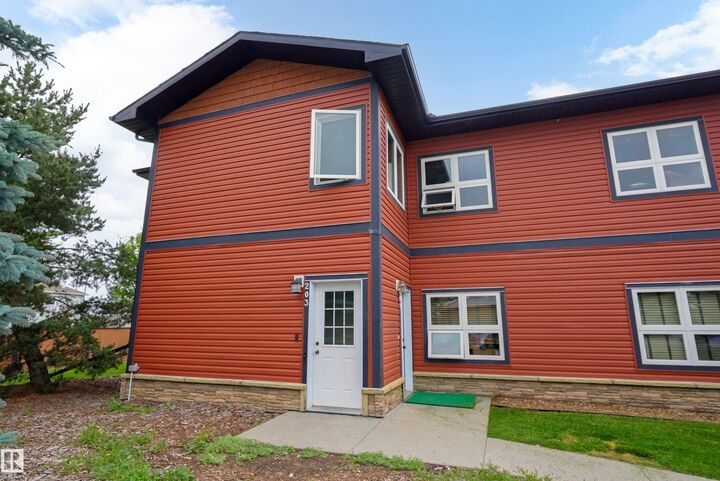






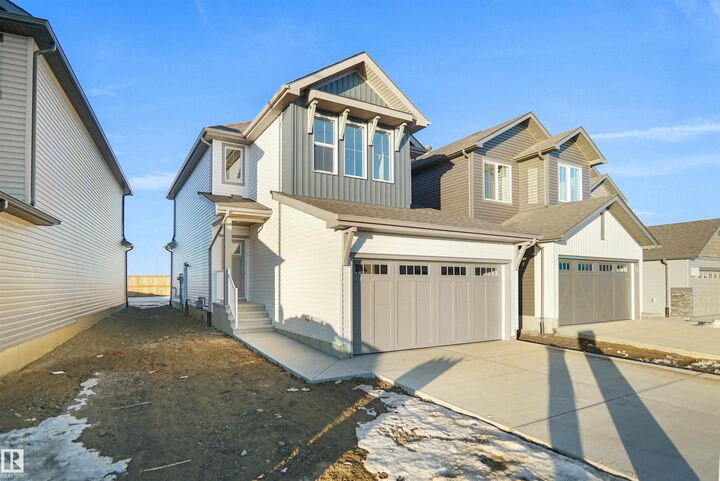
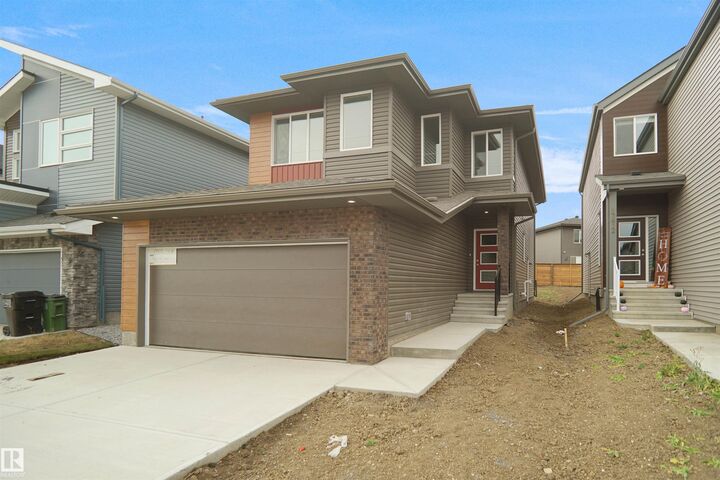

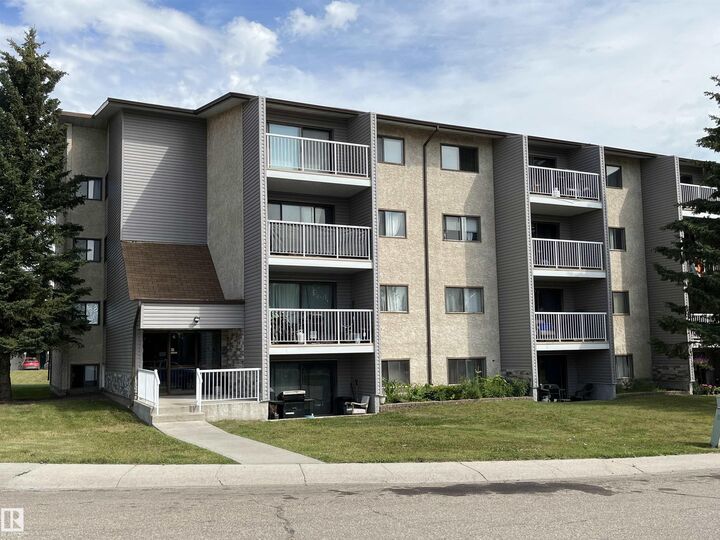

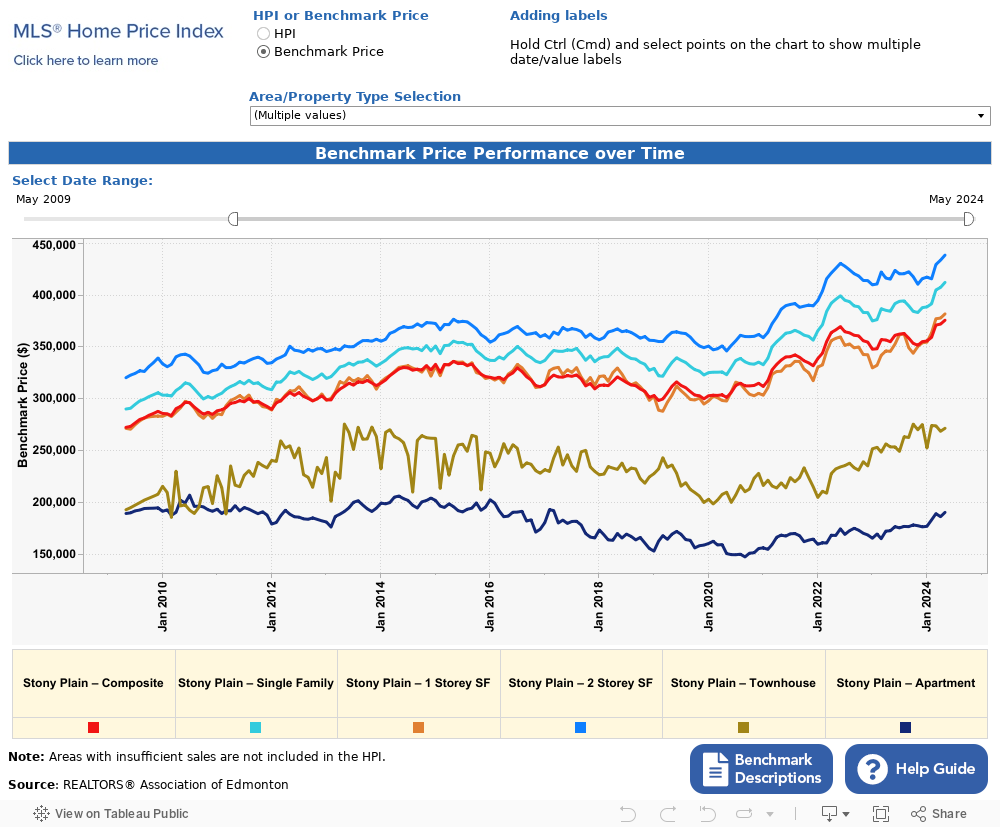
Stony Plain Real Estate Market Update: June 2026
The Stony Plain real estate market continued to evolve in June 2026, showing a clear shift toward a more balanced and inventory-driven market. While home prices remained stable and even posted modest gains, the biggest story this month is the dramatic increase in both new listings and days on market, signalling a noticeable change in buyer behaviour.
As we move into the summer season, the data shows a market that is no longer driven by urgency, but instead by choice, strategy, and pricing precision. Let’s break down what’s happening in the Stony Plain housing market for June 2026 and what it means moving forward.
📊 June 2026 Market Snapshot
| Metric | June 2026 | June 2025 | % Change |
| Sold Properties | 46 | 53 | -13.21% |
| YTD Sold Properties | 228 | 257 | -11.28% |
| Average Asking Price | $446,000 | $464,000 | -3.91% |
| YTD Average Asking Price | $449,000 | $438,000 | +2.38% |
| New Listings | 64 | 44 | +45.45% |
| YTD New Listings | 325 | 319 | +1.88% |
| Average Days on Market | 93 days | 42 days | +121.43% |
| YTD Days on Market | 70 days | 42 days | +66.67% |
| Average Sale Price | $439,000 | $432,000 | +1.58% |
| YTD Average Sale Price | $425,000 | $400,000 | +6.01% |
| Ask-to-Sell Ratio | 99.1% | 98.6% | +0.53% |
| YTD Ask-to-Sell Ratio | 98.7% | 99.3% | -0.62% |
🏡 Market Overview: A Shift Toward Buyer Choice
June clearly marks a turning point in the Stony Plain market. While prices remain strong and sales activity is steady, the sharp increase in inventory and time on market shows that buyers now have more control than earlier in the year.
This isn’t a downturn — it’s a transition into a balanced, sustainable market where:
- Sellers need stronger strategies
- Buyers have more flexibility
- Pricing accuracy matters more than ever


Below Graphs Are Interactive
Stony Plain Real Estate - New MLS® Listings
🔹 New Listings Surge — Inventory Expands
June saw 64 new listings, a 45.45% increase from last year.
Year-to-date:
- 325 listings vs 319 (+1.88%)
👉 This is the biggest shift:
Inventory is finally building
More listings =
✔ More options for buyers
✔ More competition for sellers
Average Asking Price of Homes in Stony Plain
🔹 Asking Prices Adjust Downward
The average asking price dropped to $446,000, down 3.91% from last year.
Year-to-date:
- $449,000 vs $438,000 (+2.38%)
This shows:
👉 Sellers are adjusting expectations
👉 Pricing is becoming more competitive
Stony Plain Home Sales
🔹 Sales Activity Slows Slightly
In June, 46 homes sold, a 13.21% decrease compared to last year.
Year-to-date, sales are down 11.28%, with 228 homes sold compared to 257 in 2025.
👉 Key takeaway:
Buyer demand is still present, but not as aggressive as last year — buyers are taking their time.
Stony Plain Real Estate Market- Average Home Sale Price
🔹 Average Sale Price Remains Stable
The average sale price rose to $439,000, a 1.58% increase year-over-year.
Year-to-date:
- $425,000 in 2026
- $400,000 in 2025
- +6.01% increase
👉 Even with more listings and slower sales:
Home values are holding strong
🔹 Ask-to-Sell Ratio Remains Strong
The ask-to-sell ratio sits at 99.1%, meaning homes are still selling close to asking price.
Year-to-date: 98.7%
👉 Despite slower pace:
Well-priced homes are still performing extremely well
Stony Plain Average Days on Market
🔹 Days on Market Remains Elevated
🔹 Days on Market Skyrocket
This is the headline metric.
Homes are now taking:
- 93 days to sell
- Up 121.43% from last year
Year-to-date:
- 70 days vs 42 (+66.67%)
👉 This confirms:
- Buyers are slower
- Decisions are more calculated
- Overpriced homes sit longer
🌟 Why Stony Plain Remains Strong
Even with shifting dynamics, Stony Plain continues to stand out:
- Affordable vs Edmonton
- Strong community appeal
- Growing infrastructure
- Consistent price growth
👉 This is a long-term stable market
🔮 What to Expect Heading Into Summer 2026
Looking ahead:
- Inventory will continue rising
- Buyers will remain selective
- Prices will grow slowly but steadily
- Market balance will continue
👉 Expect a more strategic summer market — not a slowdown
📊 YTD Market Comparison (2026 vs 2025)
| Metric | 2026 YTD | 2025 YTD | % Change |
| Sold Properties | 228 | 257 | -11.28% |
| Average Asking Price | $449,000 | $438,000 | +2.38% |
| New Listings | 325 | 319 | +1.88% |
| Days on Market | 70 days | 42 days | +66.67% |
| Average Sale Price | $425,000 | $400,000 | +6.01% |
| Ask-to-Sell Ratio | 98.7% | 99.3% | -0.62% |
📞 Thinking About Buying or Selling in Stony Plain?
The market is shifting — and having the right strategy matters more than ever.
I’m Chris Reid, REALTOR® with Century 21 Leading, specializing in Stony Plain and surrounding areas.
📱 Call or Text: (780) 717-5267
📧 Email: creid@chrisreidedmonton.com
🌐 Website: chrisreidedmonton.com
Data provided by the REALTORS® Association of Edmonton and subject to change. Always consult with a real estate professional for the most current market information.
If you are considering buying or selling a home in Stony Plain or just want more information on the Stony Plain real estate market, CONTACT ME HERE.
Leduc Real Estate Market Update:June 2026
The Leduc real estate market delivered a strong performance in June 2026, with sales activity surging more than 24% compared to the same month last year. While buyers continue to benefit from increased inventory and greater choice, demand remains healthy, demonstrating why Leduc continues to be one of the most attractive communities in the Edmonton Metropolitan Region.
The June numbers paint a picture of a market that is balancing itself naturally. Inventory has increased significantly, homes are taking longer to sell, and buyers have more options than they did a year ago. Yet despite these changes, sales are up, sellers continue to achieve strong prices, and the market remains highly active heading into the summer months.
Whether you're planning to buy, sell, build, or invest, here's what the latest market data tells us about the Leduc housing market.
📊 June 2026 Market Snapshot
According to the latest market update:
- 97 homes sold
- Average sale price: $439,000
- Average asking price: $509,000
- 175 new listings
- 48 average days on market
- 0.985 ask-to-sell ratio
🏗️ New Construction Market Update – June 2026 vs June 2025
The new construction segment of the Leduc housing market experienced substantial growth in June 2026, with both sales activity and overall dollar volume increasing dramatically compared to the same month last year.
A total of 18 new construction homes sold in June 2026, compared to just 4 sales in June 2025, representing a remarkable 350% increase in builder sales activity year-over-year. This significant jump highlights the continued demand for modern homes and growing interest in Leduc's newer communities.
The average sold price for a new construction home reached $531,150 in June 2026, compared to $483,725 in June 2025, representing a 9.8% increase. The median sold price also increased from $497,500 to $520,000, demonstrating that buyers remain willing to pay a premium for newer homes featuring modern layouts, energy-efficient construction, and updated finishes.
Perhaps most impressive was the increase in overall sales volume. Builders generated more than $9.56 million in new home sales during June 2026, compared to $1.93 million in June 2025, representing an extraordinary 394% increase in total dollar volume sold.
📊 New Construction Comparison Chart
| Metric | June 2026 | June 2025 | % Change |
|---|---|---|---|
| New Construction Sales | 18 | 4 | ↑ 350.0% |
| Average List Price | $538,137 | $479,425 | ↑ 12.2% |
| Average Sale Price | $531,150 | $483,725 | ↑ 9.8% |
| Median Sale Price | $520,000 | $497,500 | ↑ 4.5% |
| Highest Sale Price | $845,000 | $530,000 | ↑ 59.4% |
| Lowest Sale Price | $405,000 | $409,900 | ↓ 1.2% |
| Average Days on Market | 57 | 48 | ↑ 18.8% |
| Median Days on Market | 48 | 50 | ↓ 4.0% |
| Total Sales Volume | $9,560,713 | $1,934,900 | ↑ 394.1% |
Interactive bar graphs
Leduc New MLS® Listings
- 🆕 New Listings Continue to Flood the Market
Inventory remains the biggest story of 2026.
Leduc recorded 175 new listings in June, representing a remarkable 43.44% increase compared to June 2025.
Year-to-date, there have been 832 new listings, compared to 615 during the same period last year, representing a 35.28% increase.
This increase in inventory is creating:
- More opportunities for buyers
- More competition among sellers
- More balanced market conditions
For buyers, this means greater selection and less pressure to make rushed decisions. For sellers, it means preparation and pricing strategy have become more important than ever.
Average List Price
📌 Average Asking Price
Seller confidence remains strong across the Leduc market.
The average asking price climbed to $509,000 in June 2026, representing a 3.67% increase compared to June 2025.
This increase indicates that homeowners continue to believe in the long-term value of their properties and are pricing accordingly.
On a year-to-date basis, the average asking price sits at $493,000, up 1.35% compared to the first half of 2025.
This steady growth demonstrates that pricing expectations remain healthy despite shifting market conditions.
Leduc Home Sales
💵 Average Sale Price Shows Stability
While sales activity increased substantially, home prices remained relatively stable.
The average sale price in June 2026 was $439,000, representing a 2.60% decrease compared to June 2025.
At first glance, this decline may seem significant, but context matters. With inventory levels increasing dramatically and more entry-level homes entering the market, some fluctuation in average prices is expected.
Looking at the year-to-date numbers provides a clearer picture. The average sale price in 2026 sits at $449,000, compared to $454,000 during the same period in 2025, representing only a 1.06% decrease overall.
This suggests that home values have remained remarkably resilient despite a major increase in available inventory.
Average Sale Price
📌 Average Sale Price
The average sale price of $439,000 reflects a market that is becoming more balanced rather than declining. Buyers have more options and more negotiating power than they did in previous years, yet sellers continue to achieve strong values overall.
With the average sale price remaining close to last year's levels despite inventory increasing more than 35%, the Leduc market continues to demonstrate impressive stability.
📉 Ask-to-Sell Ratio
The average ask-to-sell ratio was 0.985, meaning homes sold for approximately 98.5% of their asking price.
While this represents a slight decline compared to last year, it remains a strong result for sellers and indicates that well-priced homes continue to attract serious buyers.
Year-to-date, the ask-to-sell ratio sits at 0.989, showing only a minor decrease from 2025.
Average Days on Market
⏳ Days on Market
As inventory increases, homes are naturally taking longer to sell.
The average days on market in June was 48 days, representing a 33.33% increase over June 2025.
Year-to-date, homes are taking an average of 55 days to sell, compared to 44 days during the same period last year.
This trend reflects buyer behaviour rather than weak demand. Buyers simply have more options available and are taking additional time to compare properties before making offers.
📊 June 2025 vs June 2026 Comparison
| Metric | June 2026 | June 2025 | % Change |
| Sold Properties | 97 | 78 | ↑ 24.36% |
| Average Asking Price | $509,000 | $491,000 | ↑ 3.67% |
| Average Sale Price | $439,000 | $451,000 | ↓ 2.60% |
| New Listings | 175 | 122 | ↑ 43.44% |
| Days on Market | 48 | 36 | ↑ 33.33% |
| Ask-to-Sell Ratio | 0.985 | 0.994 | ↓ 0.89% |
📊 Year-to-Date Comparison (2026 vs 2025)
| Metric | 2026 YTD | 2025 YTD | % Change |
| Sold Properties | 449 | 429 | ↑ 4.66% |
| Average Asking Price | $493,000 | $486,000 | ↑ 1.35% |
| Average Sale Price | $449,000 | $454,000 | ↓ 1.06% |
| New Listings | 832 | 615 | ↑ 35.28% |
| Days on Market | 55 | 44 | ↑ 25.00% |
| Ask-to-Sell Ratio | 0.989 | 0.994 | ↓ 0.54% |
🧠 What This Means for the Summer 2026 Market in Leduc
The June statistics suggest that Leduc has entered one of the healthiest and most balanced market environments we've seen in years.
Sales are increasing, inventory is growing, and prices remain relatively stable. This combination benefits both buyers and sellers.
Buyers have more options and negotiating opportunities than they did during the highly competitive markets of recent years. At the same time, sellers continue to achieve strong prices because demand remains healthy.
If these trends continue through the summer:
- Buyers will enjoy greater selection.
- Sellers will need to focus on presentation and pricing.
- Home values should remain stable.
- The market will continue operating at a sustainable pace.
🏗️ New Construction Outlook
New construction continues to be an important contributor to Leduc's growth. Communities such as Black Stone, Meadowview, Woodbend, Robinson, and Southfork continue to attract buyers seeking modern layouts, energy-efficient features, and family-friendly amenities.
As builder inventory grows and more quick possession homes become available, new construction will likely remain one of the strongest segments of the Leduc market throughout the remainder of 2026.
🏘️ What This Means for Buyers
- More inventory than last year
- Greater negotiating opportunities
- Stable pricing
- Increased selection in both resale and new construction
This may be one of the most buyer-friendly summer markets we've seen in recent years.
💼 What This Means for Sellers
- Demand remains strong
- Proper pricing is critical
- Competition has increased
- Professional marketing and presentation matter more than ever
Homes that are priced correctly and marketed effectively continue to perform exceptionally well.
📞 Thinking of Buying or Selling in Leduc?
Whether you're planning to buy your first home, upgrade to a larger property, invest in real estate, or sell your current home, understanding market conditions is essential.
If you'd like a customized market evaluation or want to discuss your next move, I'd be happy to help.
Chris Reid
Century 21 Leading
📱 (780) 717-5267
📧 creid@chrisreidedmonton.com
If you would like more information on the Leduc real estate market contact Chris Reid


Rural Leduc County Real Estate Market Update – May 2026
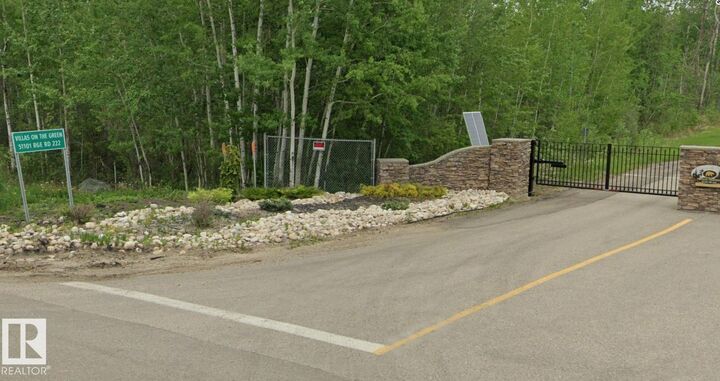
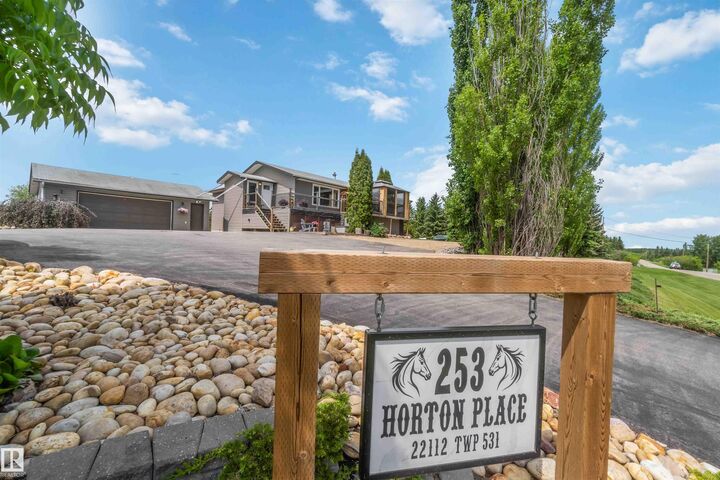
The Rural Leduc County real estate market continued to demonstrate remarkable resilience in May 2026, with acreage properties maintaining strong values despite fewer new listings coming to market. Buyers remained active throughout the month, helping drive both sales volume and average sale prices higher compared to the same period last year.
For acreage owners considering selling, the current market continues to provide favourable conditions. Inventory remains relatively limited while buyer demand remains healthy, particularly for well-maintained acreages offering modern homes, shops, outbuildings, and easy access to Edmonton, Beaumont, Leduc, Nisku, and the Edmonton International Airport.
Whether you're considering buying your first acreage, upgrading to a larger property, or preparing to sell, understanding current market trends can help you make informed decisions.
| May 2026 Rural Leduc County Market Snapshot | |
|---|---|
| Properties Sold | 20 (+11.1% YoY) |
| New Listings | 45 (-10.0% YoY) |
| Average Sale Price | $831,000 (+15.0% YoY) |
| Average Asking Price | $902,000 (+10.1% YoY) |
| Days on Market | 63 (+125.0% YoY) |
| Ask-to-Sell Ratio | 97.1% |
Bar graphs below are interactive
Leduc County -Acreage Listings
New Listings Tighten
One of the most interesting trends this month was the decline in new inventory.
Only 45 new listings came to market in May, a 10% decrease compared to May 2025. While this may appear concerning at first glance, lower inventory often benefits sellers by reducing competition and helping support property values.
Despite the monthly decline, year-to-date listing activity remains slightly ahead of last year. Rural Leduc County has recorded 166 new listings in 2026, compared to 159 during the same period in 2025, representing a 4.4% increase.
Leduc County - Average Acreage List Price
Asking Prices Remain Strong
Seller confidence also remained elevated throughout May.
The average asking price reached $902,000, an increase of 10.14% year-over-year. Sellers continue to recognize the value of their properties and are entering the market with ambitious pricing expectations.
Interestingly, year-to-date average asking prices have moderated slightly, sitting at $855,000 compared to $880,000 last year, representing a modest 2.85% decline.
This shift suggests that while sellers remain confident, pricing may be becoming more realistic overall, helping facilitate stronger sales activity.
Leduc County -Acreage Sales
A total of 20 properties sold in Rural Leduc County during May 2026, representing an 11.11% increase compared to May 2025. This continued growth demonstrates that buyers remain confident in the acreage market despite higher borrowing costs and ongoing economic uncertainty.
Year-to-date, 65 properties have sold, compared to 55 during the same period in 2025, an impressive 18.18% increase in sales activity. This suggests that the acreage market has gained momentum throughout the first five months of the year.
Average Sale Price
Acreage Prices Continue Climbing
Property values remained one of the strongest aspects of the Rural Leduc County market in May.
The average sale price reached $831,000, a substantial 14.97% increase compared to May 2025. This indicates that buyers continue to place significant value on acreage living, larger lots, privacy, and rural lifestyles close to Edmonton.
Looking at the year-to-date numbers, the average sale price sits at $843,000, compared to $774,000 at this point last year. This represents an 8.84% increase in overall property values.
These price gains reflect ongoing demand for acreages that offer a balance between country living and convenient access to urban amenities.
Ask-to-Sell Ratio Remains Healthy
The average ask-to-sell ratio came in at 97.1%, meaning sellers received approximately 97 cents for every dollar of asking price.
Year-to-date, the ratio remains at 97.1%, only slightly below last year's 98.1%.
This demonstrates that buyers and sellers continue to find common ground when negotiating, creating a healthy and balanced market environment.
Leduc County Acreage Average Days on Market
Homes Taking Longer to Sell
While pricing and sales activity were strong, properties did take longer to sell during May.
The average time on market increased to 63 days, up significantly from May 2025.
Year-to-date, the average selling time has increased to 86 days, compared to 73 days during the same period last year, representing a 17.81% increase.
This trend isn't unusual in acreage markets, where buyers typically spend more time evaluating factors such as:
- Property condition
- Water and septic systems
- Outbuildings
- Shop space
- Land usability
- Commute times
- Future development opportunities
While homes may be taking longer to sell, strong price growth indicates that buyers remain willing to pay for quality properties.



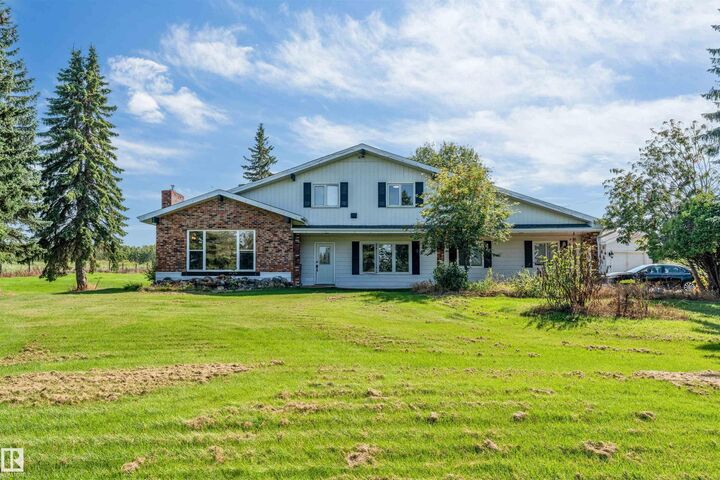
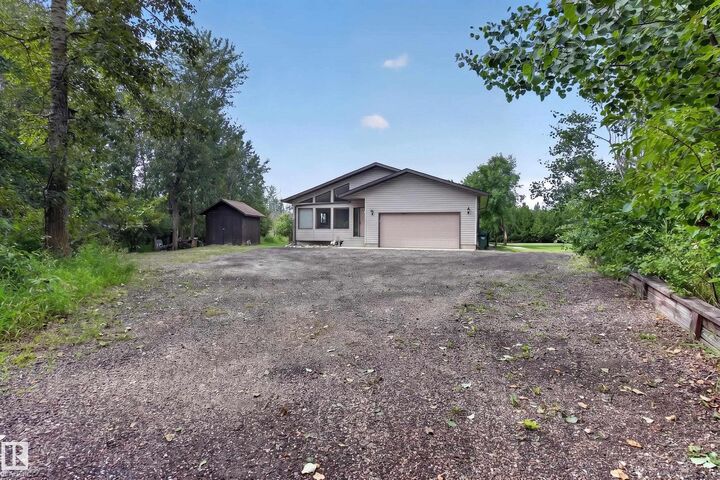
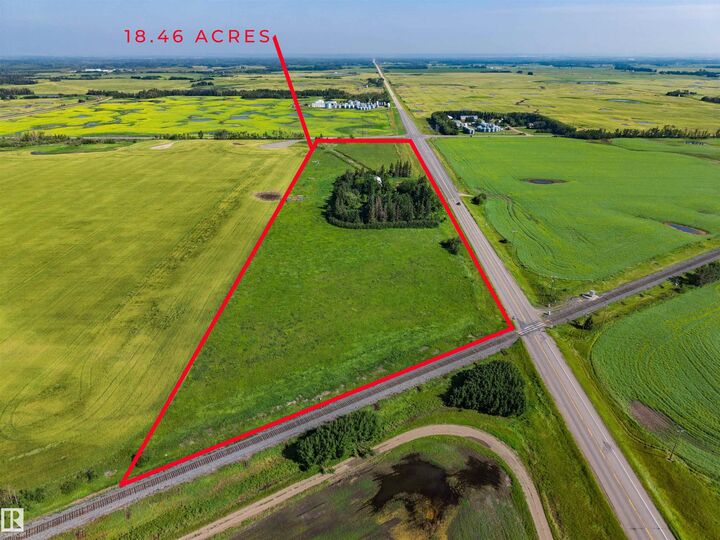
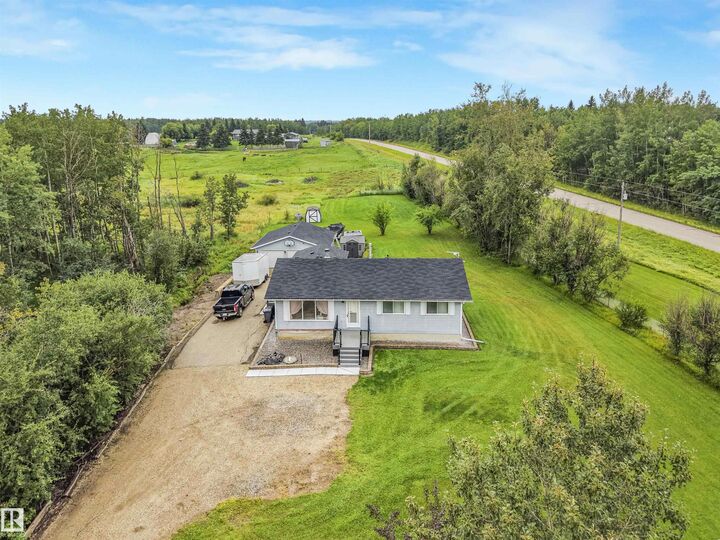



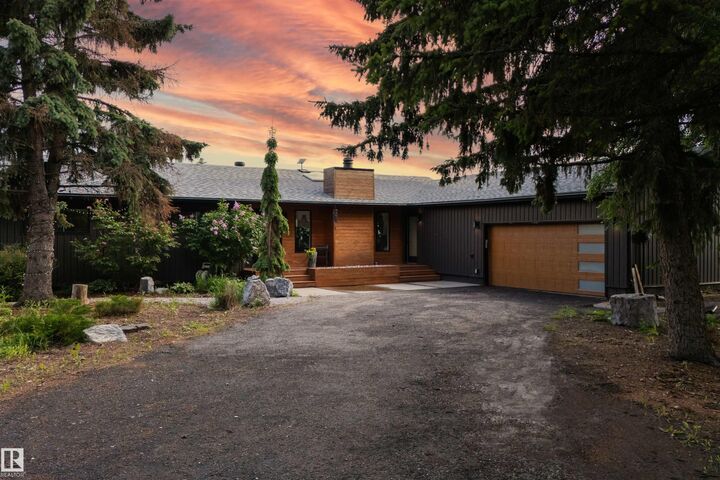
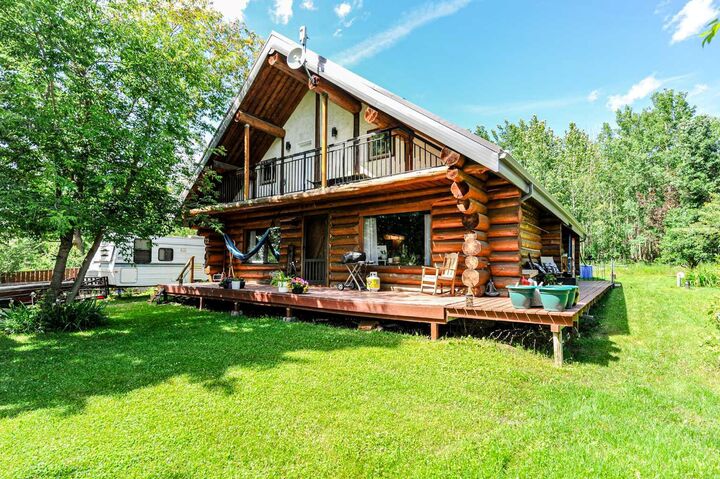
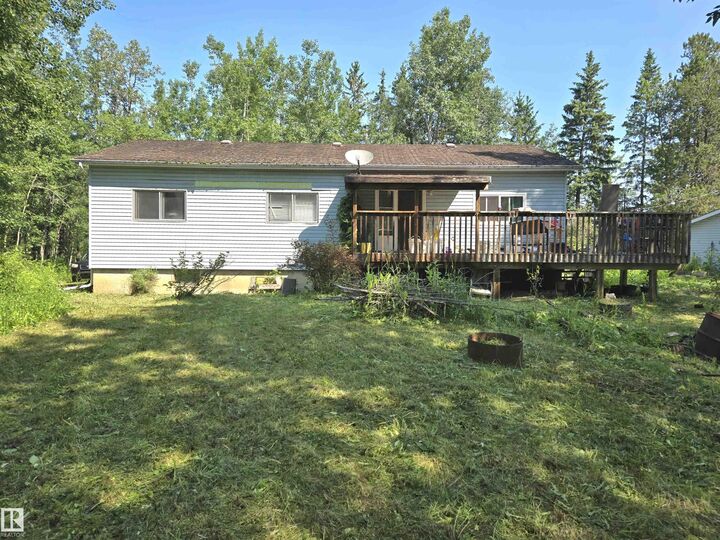
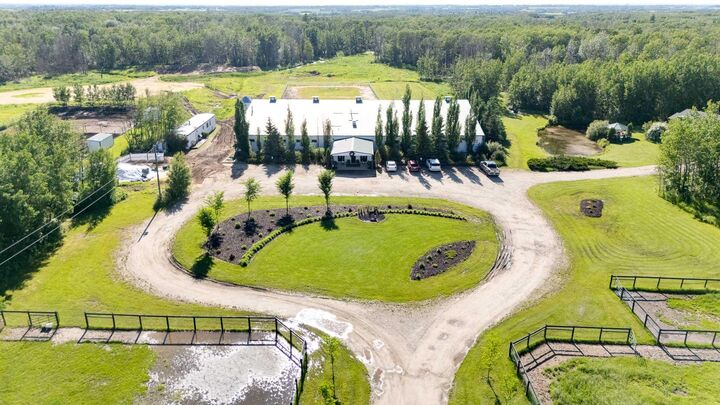


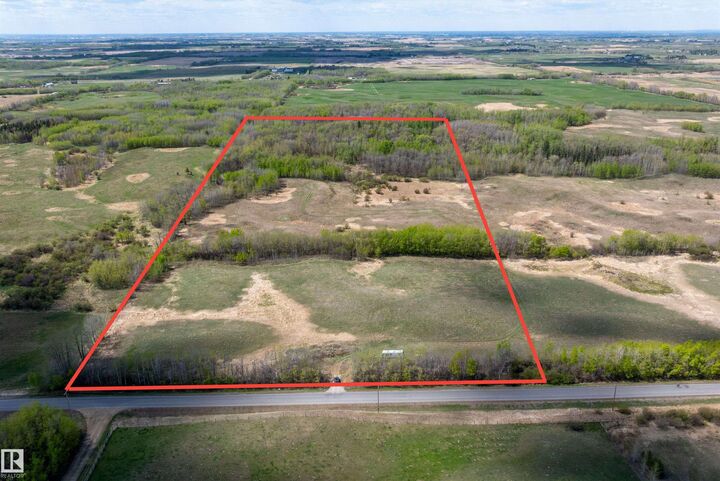
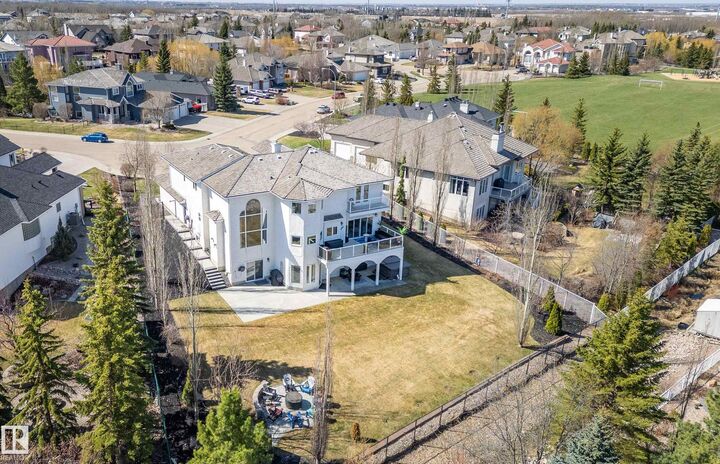
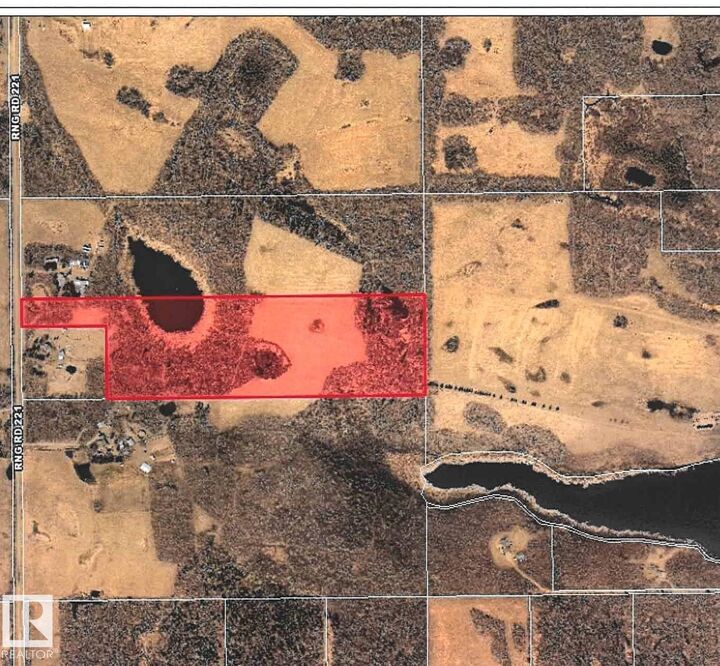
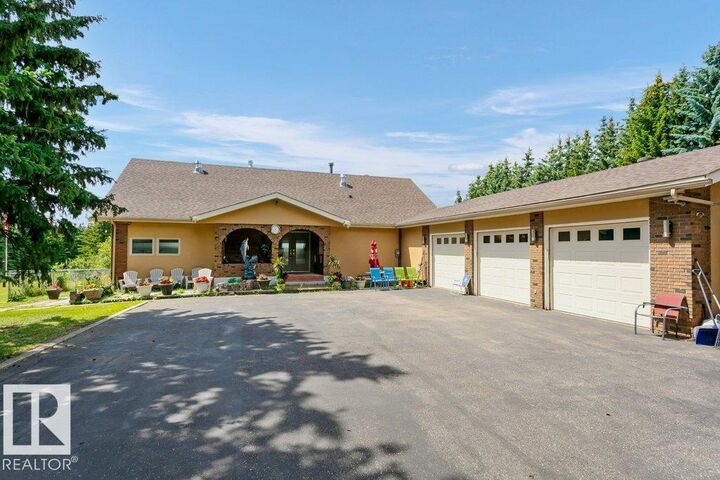

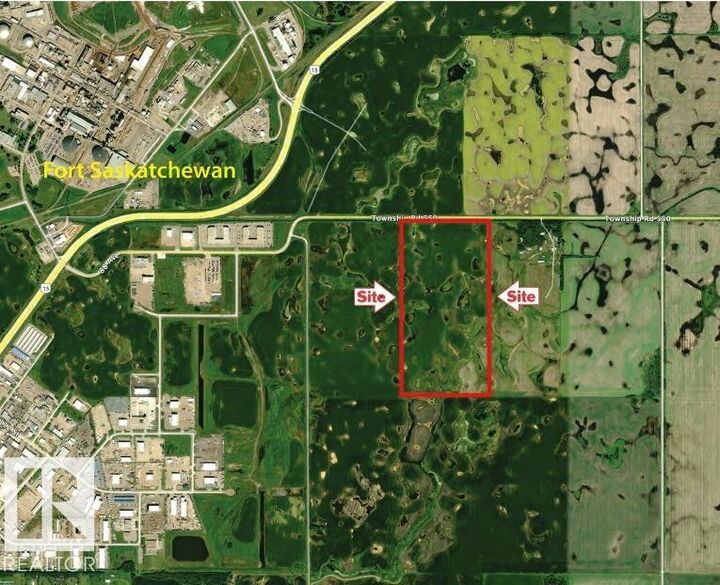
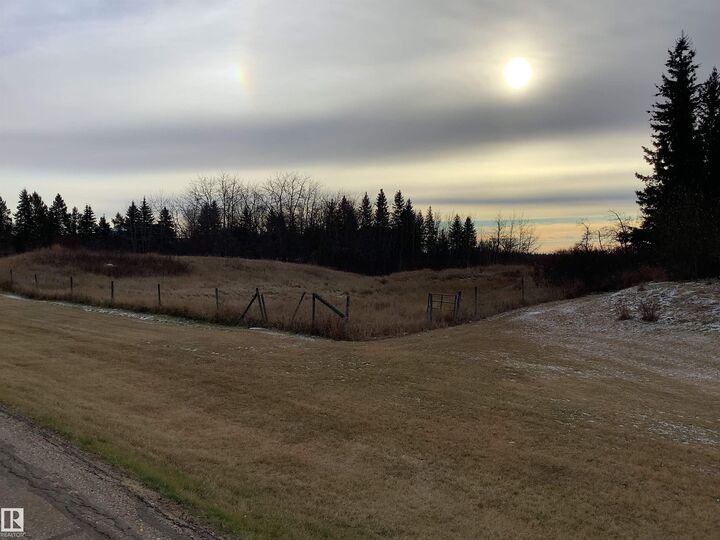
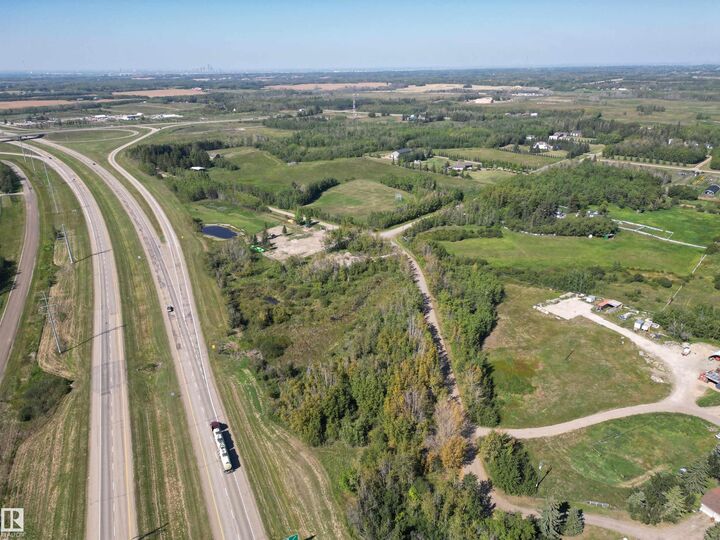
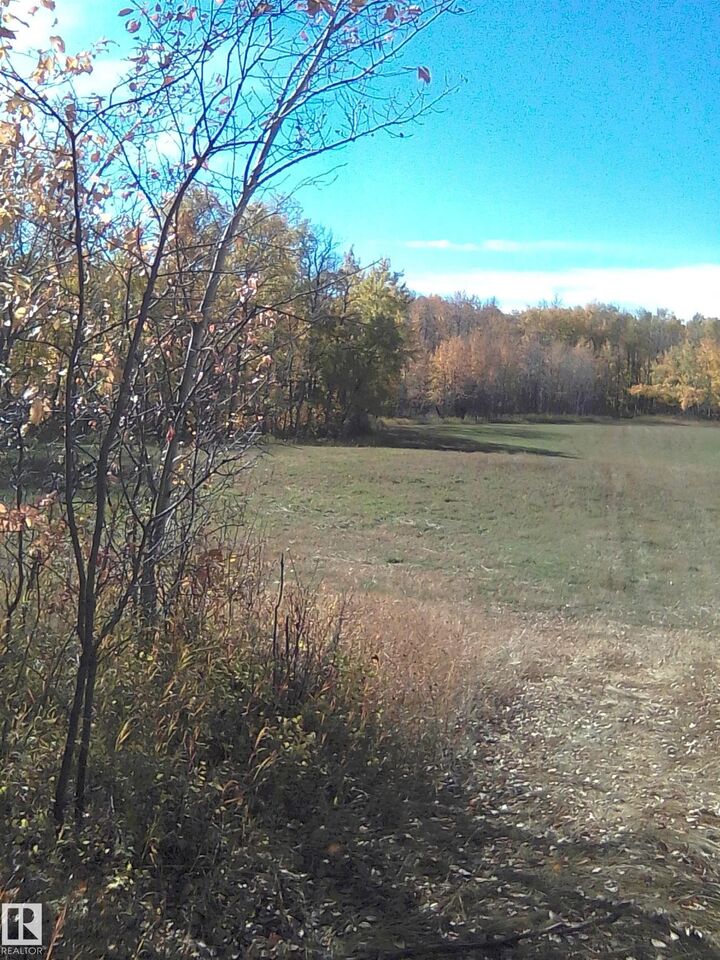

Rural Strathcona County Real Estate Market Update – May 2026
As we move deeper into the spring real estate season, the Rural Strathcona County acreage market continues to demonstrate resilience, strong pricing, and impressive buyer demand. While inventory remains lower than last year and overall year-to-date sales trail 2025 levels, the market is showing many signs of strength—particularly when it comes to property values, selling speed, and seller negotiating power.
For buyers and sellers alike, May's statistics provide valuable insight into where the market is heading as we approach the busy summer months.
📊 May 2026 Market Snapshot
According to the latest Rural Strathcona County market report:
- Sold Properties: 36 (no change from May 2025)
- Average Sale Price: $954,000 (-3.34%)
- Average Asking Price: $1.13M (+12.43%)
- New Listings: 69 (-14.81%)
- Days on Market: 45 days (-48.86%)
- Ask-to-Sell Ratio: 0.999 (+0.32%)
Year-to-date, the market continues to show strong appreciation despite fewer overall sales.
Bar graphs below are interactive
Strathcona County -Acreage Listings
📥 New Listings: Inventory Remains Tight
Inventory continues to be one of the defining stories of the 2026 acreage market.
In May:
- 69 new listings came to market
- Down 14.81% from May 2025
Year-to-date:
- 184 new listings
- Compared to 224 listings in 2025
- Down 17.86% overall
This ongoing inventory shortage helps explain why prices remain elevated.
For buyers:
- Fewer choices mean greater competition.
- Well-priced properties often attract significant attention.
For sellers:
- Less competition creates a favourable environment.
- Properly marketed properties have an opportunity to stand out.
Strathcona County - Average Acreage List Price
💵 Asking Prices: Seller Confidence Remains Strong
The average asking price in May climbed to $1.13 million, an increase of 12.43% year-over-year.
This reflects continued confidence among acreage owners and reinforces the strength of the rural market.
Year-to-date:
- Average asking price: $1.10 million
- Up 8.73% from 2025
Sellers continue to recognize the value of their properties, and buyers are generally accepting those valuations when homes are properly presented and competitively priced.
Strathcona County -Acreage Sales
🏡 Sales Activity: Stable Monthly Performance
May recorded 36 acreage sales, exactly matching the number of sales recorded in May 2025. While there was no year-over-year growth, maintaining sales volume despite higher prices and lower inventory is a positive sign for the market.
The graph on the report shows that monthly sales have steadily increased since January, with activity accelerating through the spring season. After a slower start to the year, buyer confidence appears to be returning.
However, on a year-to-date basis:
- 106 properties have sold in 2026
- Compared to 130 properties in 2025
- Representing an 18.46% decline
While sales volume remains below last year, the gap continues to narrow as the spring market gains momentum.
Average Sale Price
💰 Average Sale Price: Slight Monthly Dip, Strong Annual Growth
The average sale price in May 2026 was $954,000, down 3.34% compared to May 2025.
At first glance, this may seem like a sign of weakening prices. However, when viewed in context, the market remains extremely strong.
The year-to-date average sale price sits at $973,000, up 10.54% from $880,000 during the same period in 2025.
This tells us:
- Acreage values remain substantially higher than last year.
- The May decrease is likely due to the mix of properties sold rather than a decline in market demand.
- Buyers continue to pay premium prices for desirable acreage properties.
For sellers, this means property values remain elevated heading into summer.
🤝 Ask-to-Sell Ratio: Sellers Receiving Near Full Price
The average ask-to-sell ratio was 0.999, meaning sellers received virtually 99.9% of their asking price on average.
That's an exceptionally strong number and one of the highest ratios we've seen in recent months.
Year-to-date:
- Ask-to-sell ratio remains at 0.999
- Compared to 0.988 in 2025
This indicates:
- Buyers are willing to pay close to asking price.
- Sellers who price appropriately are being rewarded.
- Negotiation margins remain very small.
Strathcona County Acreage Average Days on Market
⏱️ Days on Market: Homes Selling Much Faster
One of the strongest indicators in this month's report is the improvement in selling times.
The average acreage sold in just 45 days, a remarkable 48.86% improvement over May 2025.
Even more impressive:
- YTD average days on market is 48 days
- Compared to 81 days last year
- A 40.74% improvement
This demonstrates that:
- Buyers are acting decisively.
- Properly priced homes are moving quickly.
- Demand remains healthy despite fewer listings.
For sellers, shorter days on market often translate into stronger negotiating positions and fewer price reductions.
📈 Rural Strathcona County YTD Comparison (2026 vs 2025)
| Metric | 2026 YTD | 2025 YTD | % Change |
| Sold Properties | 106 | 130 | ↓ 18.46% |
| Average Sale Price | $973K | $880K | ↑ 10.54% |
| Average Asking Price | $1.10M | $1.01M | ↑ 8.73% |
| New Listings | 184 | 224 | ↓ 17.86% |
| Days on Market | 48 | 81 | ↓ 40.74% |
| Ask-to-Sell Ratio | 0.999 | 0.988 | ↑ 1.06% |
🔎 What This Means for Buyers
Buyers entering the Rural Strathcona County market this summer should be prepared for competitive conditions.
Key takeaways:
- Inventory remains lower than last year.
- Homes are selling much faster.
- Prices continue trending upward overall.
- Strong properties may attract multiple interested buyers.
Having mortgage financing arranged and being ready to act quickly can make a significant difference in today's market.
🏡 What This Means for Sellers
For acreage owners considering a sale, conditions remain highly favourable.
Current market advantages include:
- Rising year-to-date prices.
- Limited inventory.
- Faster sales.
- Nearly full-price offers.
While some monthly pricing fluctuations occur, the overall trend remains positive, making this an attractive time to bring a property to market.
🌲 Why Buyers Continue Choosing Strathcona County Acreages
Strathcona County remains one of the most sought-after acreage markets surrounding Edmonton because it offers:
- Easy access to Sherwood Park and Edmonton
- Mature acreage communities
- Larger lots and privacy
- Luxury estate properties
- Hobby farm opportunities
- Strong long-term appreciation potential
Communities such as Ardrossan, South Cooking Lake, Antler Lake, Hastings Lake, and Half Moon Lake continue to attract strong buyer interest.
🔮 Looking Ahead to Summer 2026
Based on the current statistics, several trends are likely to continue through June and July:
- Inventory may remain constrained.
- Competition for quality acreages will likely stay strong.
- Days on market should remain below historical averages.
- Price growth may moderate but remain positive overall.
Unless a significant increase in listings occurs, supply and demand dynamics should continue supporting property values.
🌾 Final Thoughts
May 2026 confirms that the Rural Strathcona County acreage market remains one of the strongest rural real estate markets surrounding Edmonton.
While year-to-date sales volume is still catching up to 2025, the market is benefiting from:
- Strong price appreciation
- Faster sales
- Limited inventory
- Exceptional seller negotiating power
For both buyers and sellers, the coming summer months should provide excellent opportunities.
📞 Thinking About Buying or Selling an Acreage?
Whether you're looking for your dream acreage or considering selling your rural property, local expertise matters.
Chris Reid – REALTOR® | Century 21 Leading
📞 (780) 717-5267
🌐 chrisreidedmonton.com
📧 creid@chrisreidedmonton.com
Specializing in:
✔ Acreages
✔ Rural homes
✔ Estate properties
✔ Hobby farms
✔ Luxury country living
All data from the REALTORS® Association of Edmonton.




















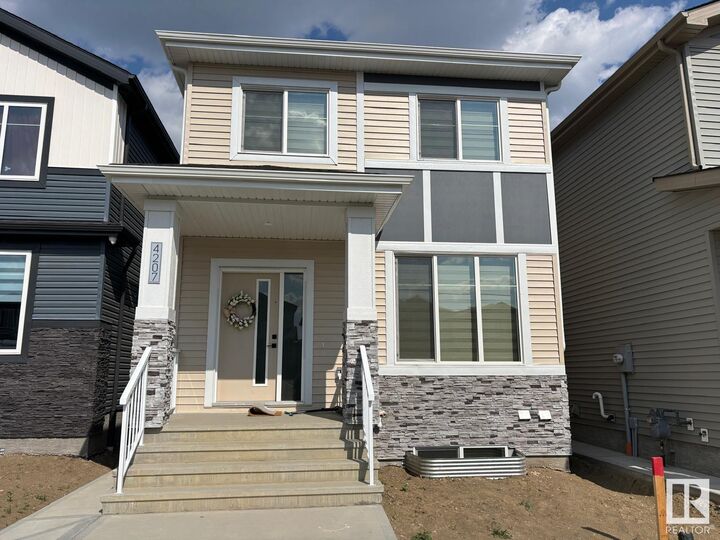
Beaumont Real Estate Market Update: May 2026 Statistics
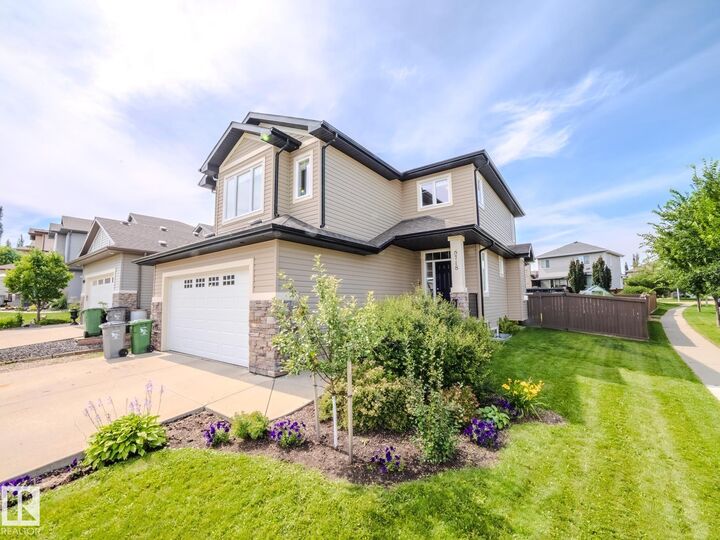
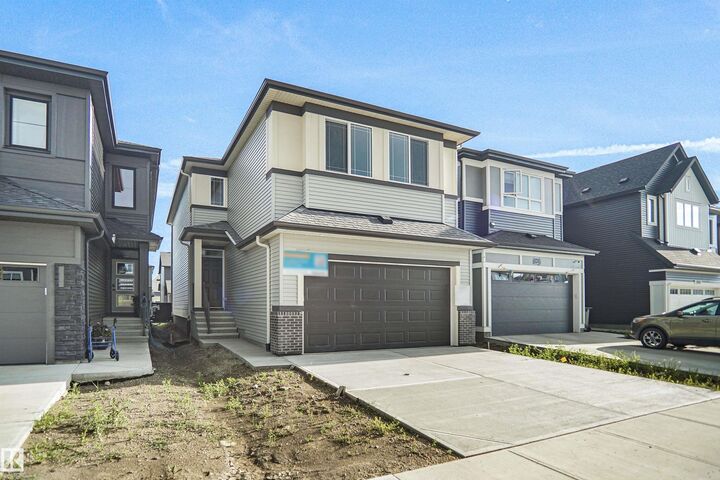
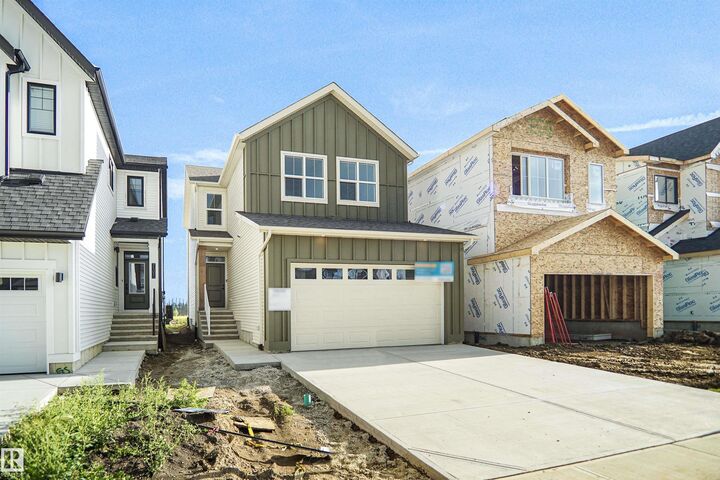
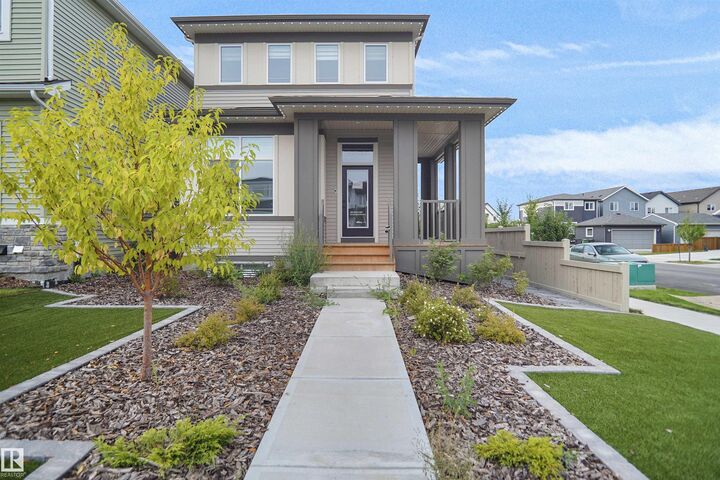
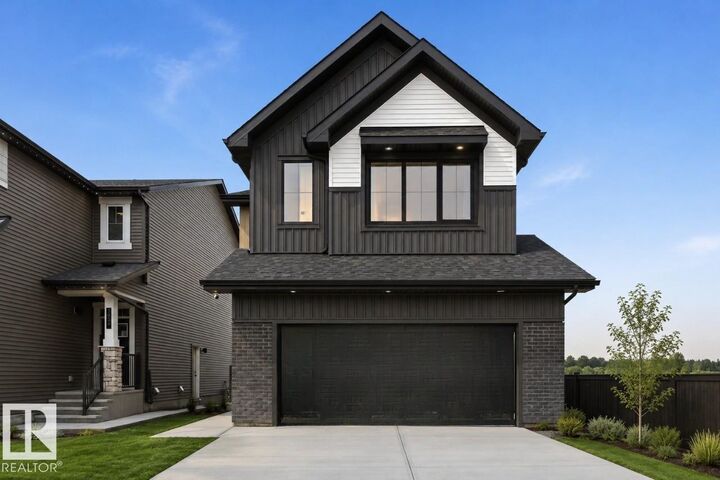
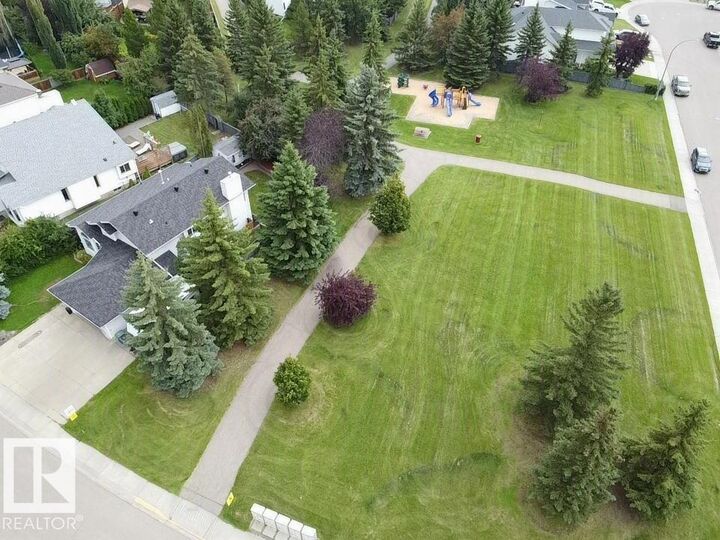
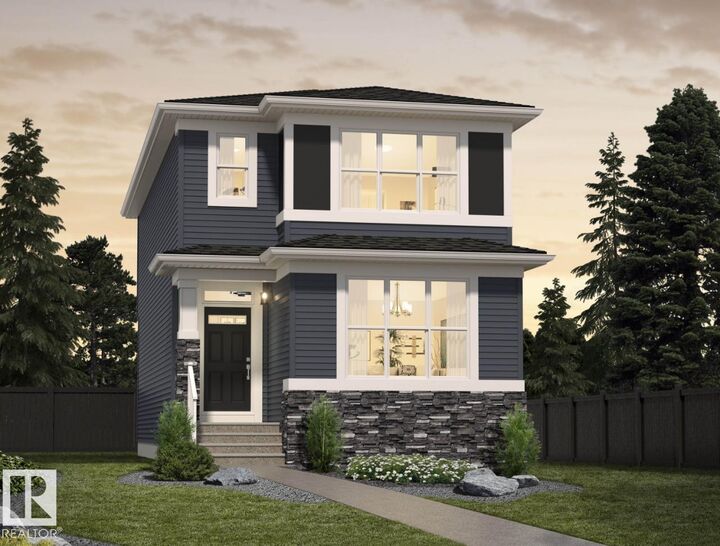
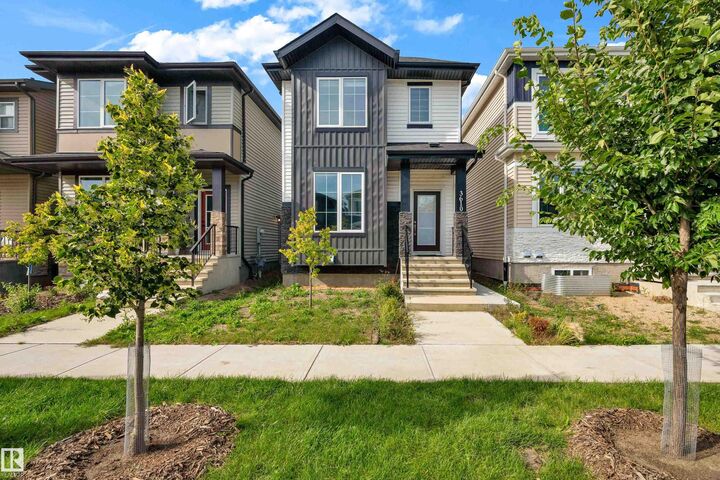
The Beaumont real estate market continued to demonstrate resilience in May 2026, with strong pricing growth, rising inventory levels, and steady buyer demand. While overall sales remained slightly below last year's pace, home values continued to appreciate, reinforcing Beaumont's position as one of the Edmonton region's most desirable communities for families, professionals, and move-up buyers.
As we move into the summer market, Beaumont remains a balanced market where buyers enjoy more choice than in previous years, while sellers continue benefiting from healthy property values. The latest statistics reveal a market that is evolving rather than slowing, creating opportunities on both sides of the transaction.
All statistics are sourced directly from the REALTORS® Association of Edmonton May 2026 Market Report.
📊 Beaumont May 2026 Market Summary
| Metric | May 2026 | May 2025 | % Change |
| Sold Properties | 53 | 54 | ↓ 1.85% |
| New Listings | 111 | 85 | ↑ 30.59% |
| Average Asking Price | $591,000 | $600,000 | ↓ 1.52% |
| Average Sale Price | $582,000 | $532,000 | ↑ 9.43% |
| Days on Market | 83 | 45 | ↑ 84.44% |
| Ask-to-Sell Ratio | 98.3% | 99.2% | ↓ 0.91% |
Interactive bar graphs
Beaumont New MLS® Listings
🏘️ Inventory Continues to Expand
One of the biggest stories in Beaumont this year continues to be inventory growth.
A total of 111 new listings came to market in May, representing a substantial 30.59% increase compared to May 2025.
This brings the year-to-date total to 408 new listings, up 17.58% from the same period last year.
This increase in inventory provides buyers with:
- More homes to choose from
- Greater negotiating power
- Additional time to evaluate options
For sellers, however, the growing inventory means increased competition. Proper pricing, professional marketing, and strong presentation have become increasingly important to stand out from competing listings.
Average Asking Price
💰 Average Asking Price in Beaumont
The average asking price in Beaumont was $591,000 in May 2026, representing a slight 1.52% decrease from May 2025.
While the monthly figure softened slightly, the broader trend remains positive. Year-to-date, Beaumont's average asking price sits at $600,000, up 2.09% compared to 2025.
This suggests sellers remain confident in the long-term strength of the Beaumont market, while also adjusting pricing strategies to align with increased competition and changing buyer expectations.
Communities such as Triomphe Estates, Forest Heights, Dansereau Meadows, and Place Chaleureuse continue attracting strong interest from buyers seeking newer homes, larger lots, and family-oriented neighbourhoods.
Beaumont Home Sales
📈 Sales Activity Remains Strong
Beaumont recorded 53 residential property sales in May 2026, only one sale fewer than May 2025. While that represents a modest 1.85% decline year-over-year, the market remains remarkably active considering the significant increase in inventory available to buyers.
The monthly sales chart shows Beaumont maintaining consistent activity throughout the first five months of the year. Sales have steadily improved from January's 21 transactions to May's 53 sales, reflecting the typical seasonal increase in buyer activity as spring transitions into summer.
Although year-to-date sales remain slightly behind 2025 levels, the difference is minimal. Beaumont has recorded 184 sales so far in 2026, compared to 188 during the same period last year, representing just a 2.13% decrease.
Average Sale Price
🏡 Average Sale Price Reaches New Highs
One of the strongest indicators in May's report was the continued growth in sold prices.
The average sale price climbed to $582,000, representing a significant 9.43% increase compared to May 2025.
This increase demonstrates that buyers remain willing to pay premium prices for desirable homes despite rising inventory levels.
Year-to-date, Beaumont's average sale price has reached $554,000, up 3.81% compared to the same period in 2025.
This is particularly encouraging because it shows property values continuing to appreciate even as inventory expands and buyers gain more options.
The monthly sales price graph included in the report shows pricing trending upward throughout the first half of 2026, with May posting one of the strongest average sale prices recorded in recent months.
📉 Ask-to-Sell Ratio Remains Healthy
The average ask-to-sell ratio in May was 98.3%, down slightly from last year.
This means sellers are still receiving very close to their asking price, with homes selling for approximately 98 cents on every dollar listed.
Although negotiation has become more common, Beaumont remains a healthy market where properly priced homes continue attracting strong offers.
Average Days on Market
⏳ Homes Continue Taking Longer to Sell
While pricing remains strong, homes are taking considerably longer to sell than they were a year ago.
The average days on market increased to 83 days, up 84.44% from May 2025.
Year-to-date, Beaumont homes are averaging 82 days on market, compared to 43 days during the same period last year — an increase of 90.70%.
This trend reflects:
- Increased inventory levels
- More selective buyers
- Longer decision-making timelines
- Greater emphasis on pricing and presentation
The days of buyers rushing into offers within hours of a property hitting the market have largely disappeared. Today's buyers are conducting more research, viewing more properties, and negotiating more carefully.
📊 Year-to-Date Market Comparison
| Metric | 2026 YTD | 2025 YTD | % Change |
| Sold Properties | 184 | 188 | ↓ 2.13% |
| New Listings | 408 | 347 | ↑ 17.58% |
| Average Asking Price | $600,000 | $588,000 | ↑ 2.09% |
| Average Sale Price | $554,000 | $534,000 | ↑ 3.81% |
| Days on Market | 82 | 43 | ↑ 90.70% |
| Ask-to-Sell Ratio | 98.3% | 99.5% | ↓ 1.18% |
🧠 What This Means for Buyers
Buyers are benefiting from the most balanced Beaumont market we've seen in several years.
Advantages include:
✔ More inventory to choose from
✔ Less pressure to compete immediately
✔ Greater negotiating power
✔ Stable long-term property values
While home prices continue rising, buyers now have more time and flexibility to find the right property.
💼 What This Means for Sellers
Sellers continue benefiting from strong property values and healthy demand.
However, success in today's market requires:
✔ Competitive pricing
✔ Professional marketing
✔ High-quality photography
✔ Strong home presentation
The good news is that Beaumont homes continue selling at nearly full asking price and average sale prices are reaching new highs.
🔮 Summer 2026 Market Outlook
Looking ahead to June and July, Beaumont appears poised for a healthy summer market.
Key trends to watch include:
📈 Continued inventory growth
📈 Stable sales activity
📈 Ongoing price appreciation
📉 Increased competition among sellers
If inventory continues to rise at its current pace, buyers will likely maintain strong negotiating leverage while sellers will need to remain strategic with pricing.
📞 Thinking About Buying or Selling in Beaumont?
Whether you're looking to buy your first home, upgrade to a larger property, or sell your current home, understanding the local market is critical.
As a Beaumont and Edmonton-area REALTOR®, Chris Reid helps clients:
✔ Understand neighbourhood trends
✔ Price homes accurately
✔ Navigate new construction opportunities
✔ Develop winning marketing strategies
✔ Negotiate confidently
📲 Call or text Chris Reid at (780) 717-5267 for a complimentary home evaluation or buyer consultation.
Data provided by the REALTORS® Association of Edmonton and subject to change. Always consult with a real estate professional for the most current market information.
If you would like more information on the Beaumont real estate market contact Chris Reid
Beaumont Website


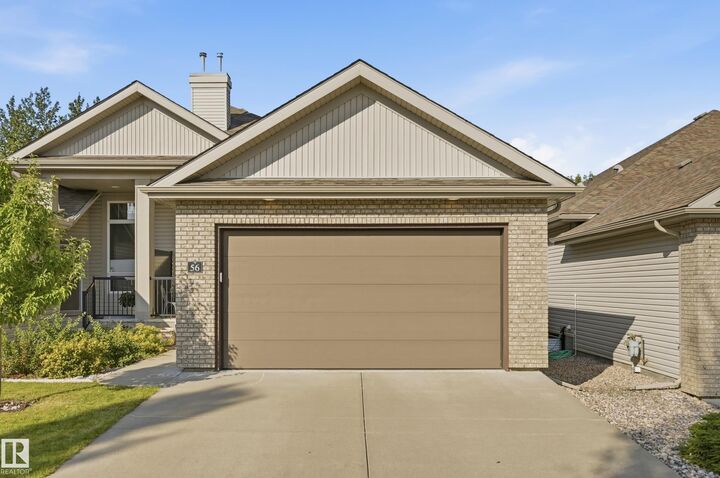
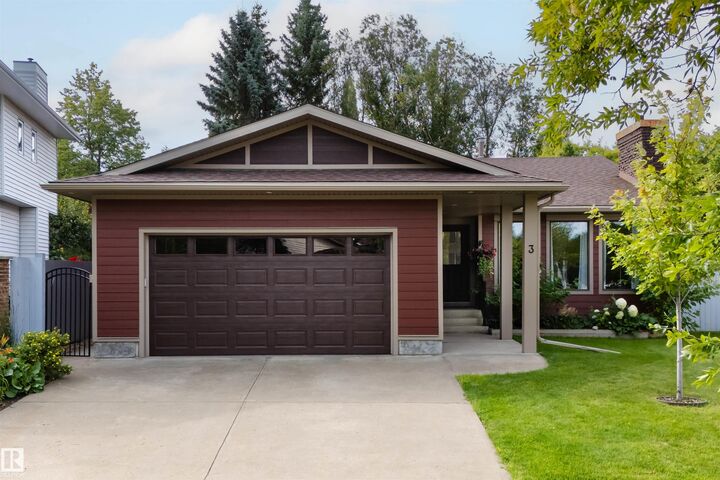







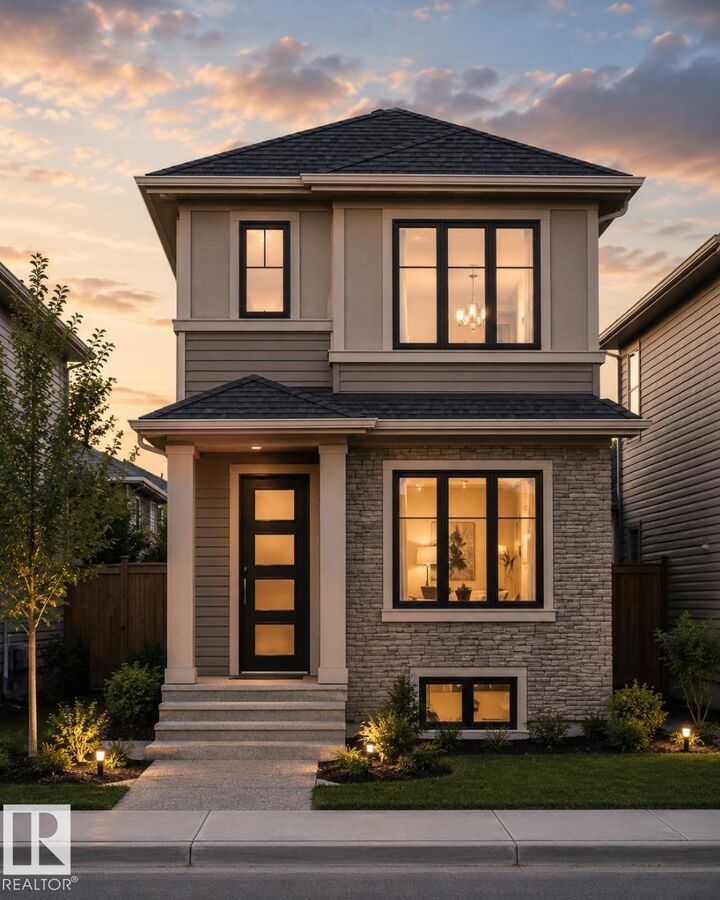
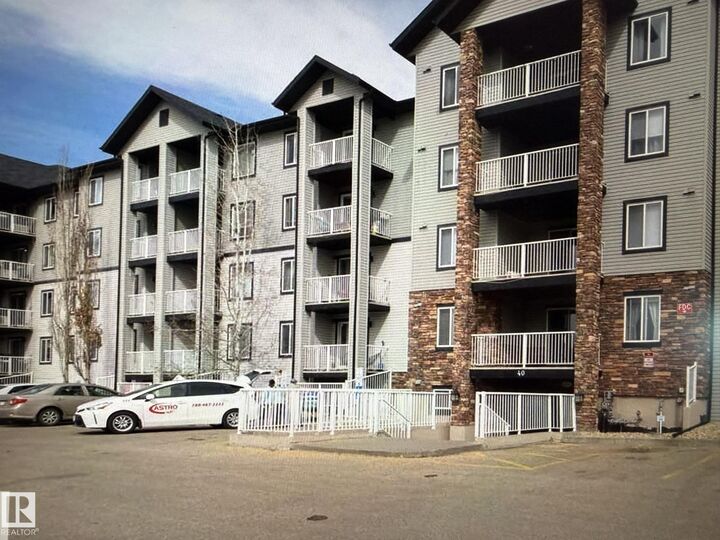
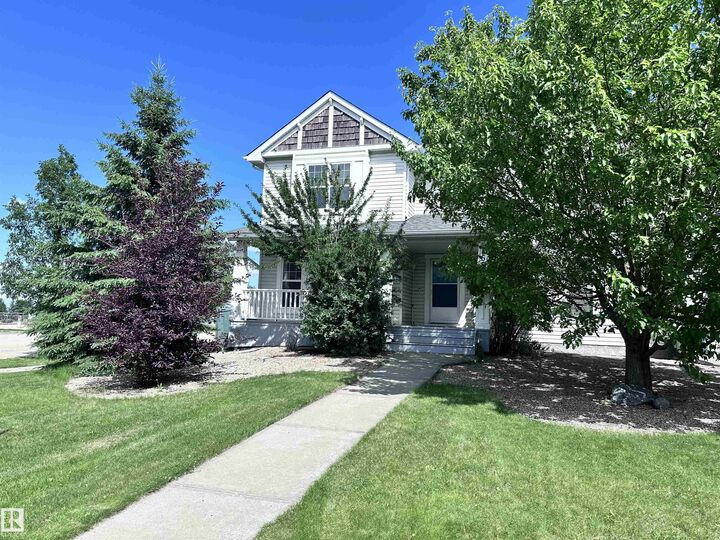
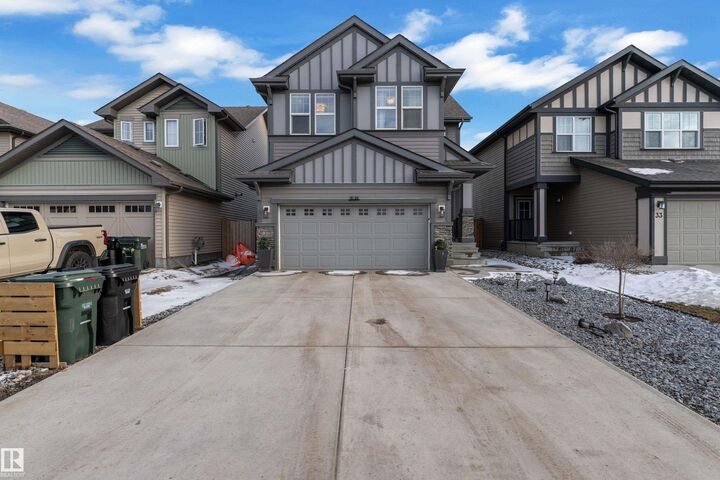
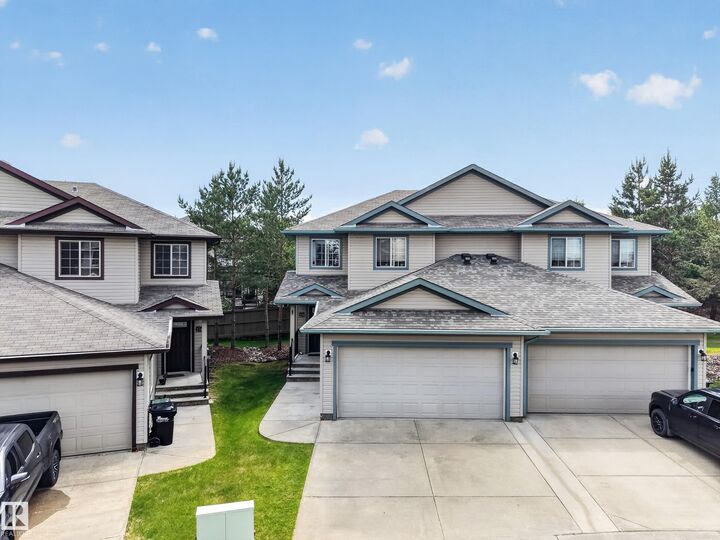
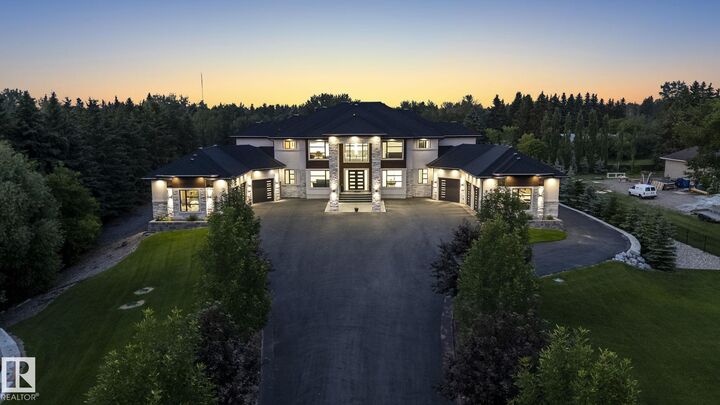
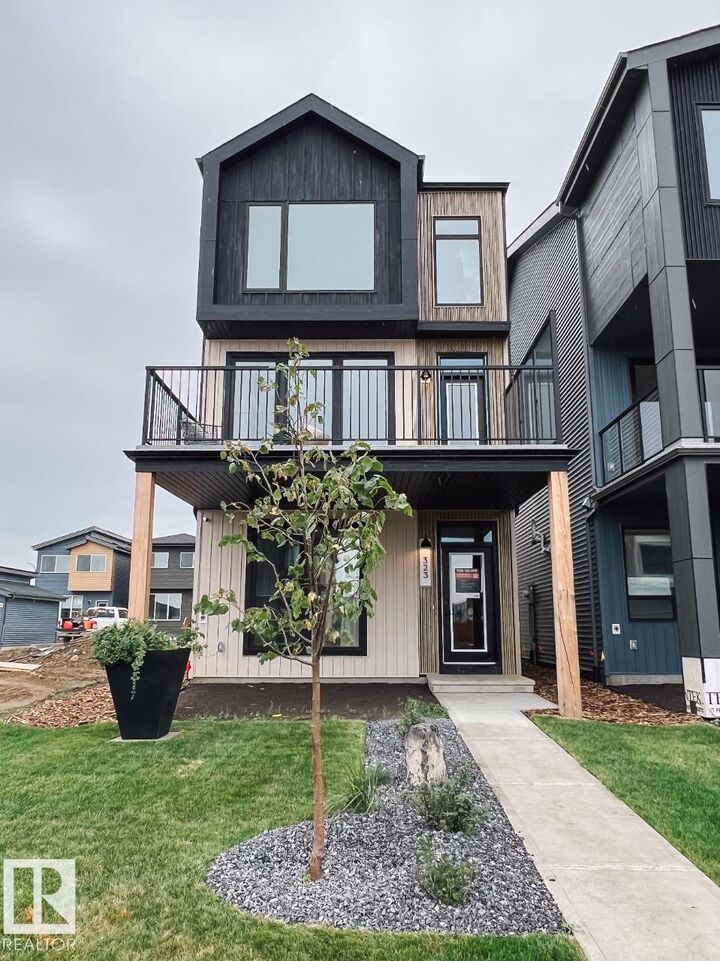
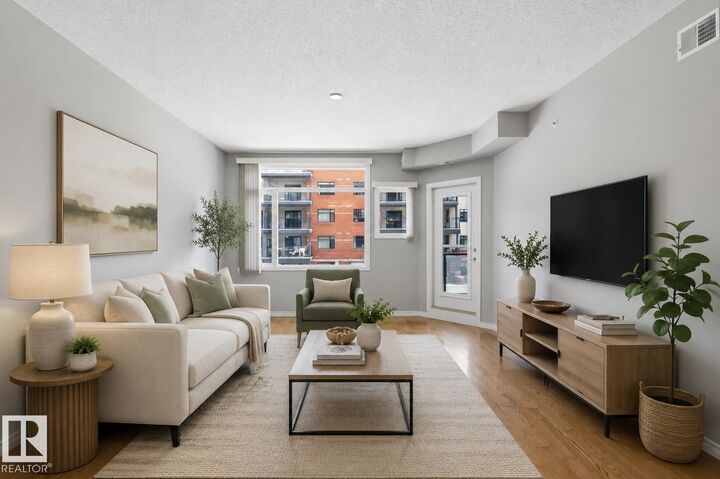
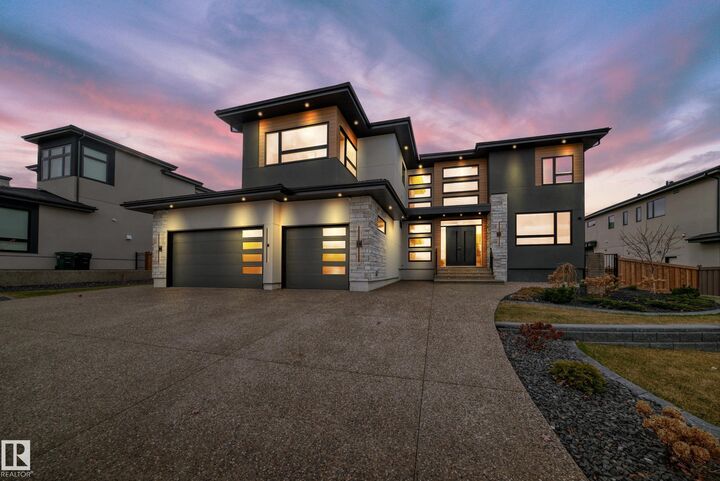
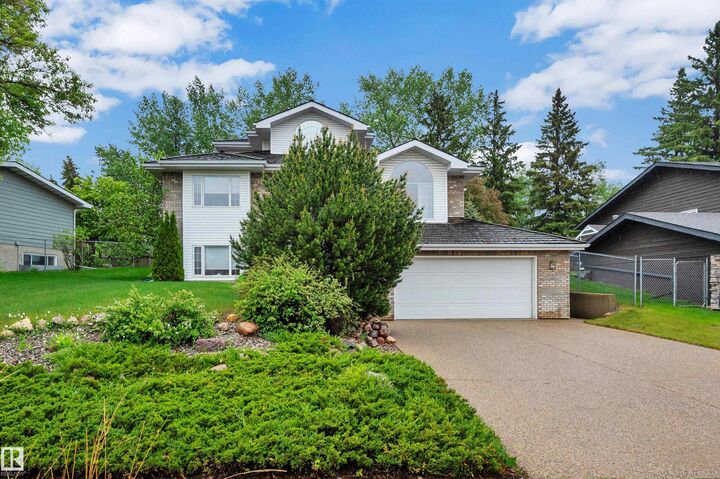
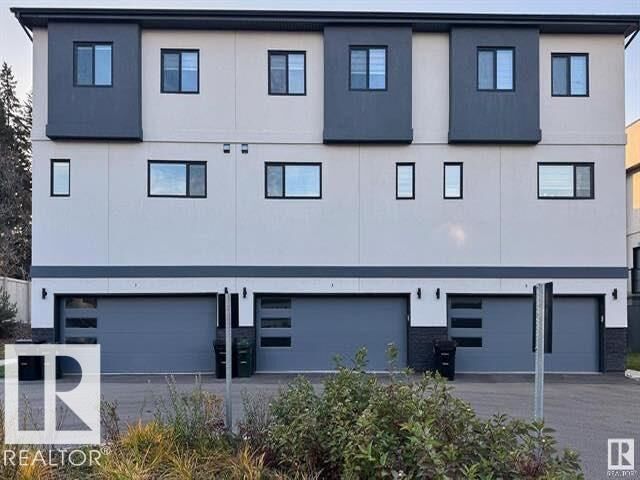
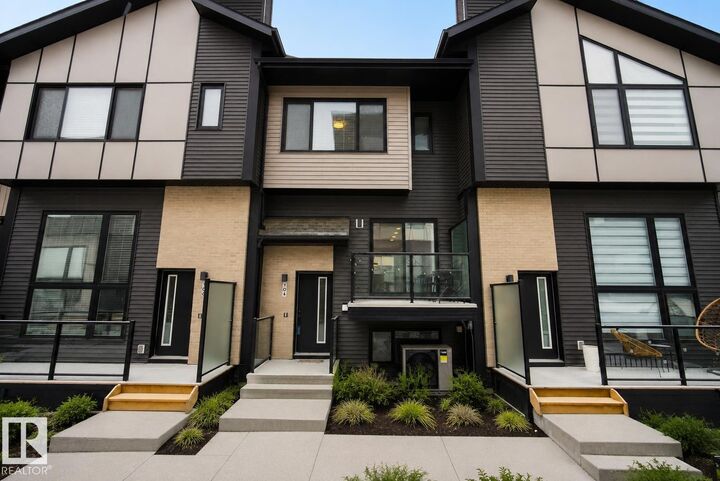
Sherwood Park Real Estate Market Update: May 2026 Statistics
The Sherwood Park real estate market continued its strong performance in May 2026, posting significant gains in sales activity while maintaining healthy price appreciation. As the spring market reaches its peak, buyers remain active, inventory levels continue to improve, and sellers are benefiting from sustained demand across multiple price points.
Sherwood Park remains one of the Edmonton region's most sought-after communities, offering residents a unique blend of suburban living, excellent schools, extensive recreation opportunities, and convenient access to Edmonton. These factors continue to support long-term housing demand and contribute to the area's resilience even as market conditions evolve.
May's numbers reveal a market that remains competitive but increasingly balanced, creating opportunities for both buyers and sellers as we move into the summer season. Let's take a closer look at what happened in the Sherwood Park housing market this month.
📊 Key Sherwood Park Real Estate Statistics – May 2026
| Metric | May 2026 | May 2025 | % Change |
| Sold Properties | 167 | 146 | +14.38% |
| Average Asking Price | $533,000 | $520,000 | +2.58% |
| New Listings | 207 | 197 | +5.08% |
| Days on Market | 29 Days | 23 Days | +26.09% |
| Average Sale Price | $539,000 | $530,000 | +1.72% |
| Ask-to-Sell Ratio | 1.003 | 1.015 | -1.14% |
Interactive bar graphs
Sherwood Park New MLS® Listings
📦 Inventory Levels Continue to Improve
One of the most positive developments for buyers is the continued increase in available inventory.
Sherwood Park saw 207 new listings hit the market in May, a 5.08% increase compared to May 2025. Year-to-date, there have been 803 new listings, up 9.40% from last year.
More inventory provides buyers with:
- Greater selection
- More flexibility
- Reduced pressure compared to previous years
For sellers, however, increasing inventory means more competition and emphasizes the importance of proper pricing, staging, and marketing.
Average Asking Price
🏷️ Sellers Continue to See Strong Pricing
The average asking price in May reached $533,000, up 2.58% from May 2025. Sellers remain confident in the market and continue to price homes competitively while still achieving strong results.
The year-to-date average asking price now sits at $529,000, representing a 3.64% increase compared to last year.
This ongoing growth in asking prices demonstrates confidence among homeowners while also reflecting the strength of demand in the marketplace.
Sherwood Park Home Sales
🏠 Sales Activity Accelerates
Sherwood Park recorded 167 residential property sales in May 2026, representing a substantial 14.38% increase over May 2025. This marks one of the strongest monthly sales performances we've seen so far this year and highlights the continued appeal of the community to buyers.
Year-to-date, sales have reached 596 homes, up 4.93% from the same period last year. This increase demonstrates that buyer confidence remains strong despite higher home prices and ongoing affordability concerns in some segments of the market.
The continued rise in sales activity suggests that many buyers who may have delayed purchasing decisions earlier in the year are now entering the market as inventory improves and confidence grows.
Average Sale Price
💰 Average Sale Price Reaches $539,000
Home values in Sherwood Park continued their upward trajectory in May, with the average sale price climbing to $539,000, a 1.72% increase compared to May 2025. While price growth has moderated compared to some of the larger gains seen over the past two years, the market continues to demonstrate healthy appreciation.
Year-to-date, the average sale price now stands at $525,000, up 3.29% compared to 2025. This consistent growth reflects the ongoing demand for homes in Sherwood Park and reinforces the community's reputation as a stable long-term investment.
The monthly sales price chart included in the report continues to show a generally upward trend throughout the past year, with only minor seasonal fluctuations. This is encouraging news for homeowners and investors alike.
📉 Ask-to-Sell Ratio Shows a More Balanced Market
The average ask-to-sell ratio was 1.003 in May, meaning homes sold for approximately 100.3% of their asking price. While this remains an excellent result for sellers, it is slightly lower than the 1.015 ratio recorded in May 2025.
Year-to-date, the ask-to-sell ratio sits at 1.002, compared to 1.015 last year.
This suggests:
- Buyers have slightly more negotiating power
- Sellers need to be strategic with pricing
- Well-priced homes still attract strong offers
Overall, the market remains healthy but is becoming more balanced than it was during peak seller-market conditions.
Average Days on Market
⏱️ Days on Market Increase
Homes in Sherwood Park spent an average of 29 days on market before selling, compared to 23 days during May 2025. This represents a 26.09% increase year-over-year.
While homes are taking longer to sell than they were during some of the hottest market conditions, 29 days remains a relatively healthy selling timeframe.
The year-to-date average now sits at 35 days, compared to 31 days in 2025.
This increase reflects:
- More inventory available
- Buyers taking more time to compare options
- A market gradually moving toward balance
📅 Year-to-Date Comparison (2026 vs 2025)
| Metric | 2026 YTD | 2025 YTD | % Change |
| Sold Properties | 596 | 568 | +4.93% |
| Average Asking Price | $529,000 | $511,000 | +3.64% |
| New Listings | 803 | 734 | +9.40% |
| Days on Market | 35 Days | 31 Days | +12.90% |
| Average Sale Price | $525,000 | $508,000 | +3.29% |
| Ask-to-Sell Ratio | 1.002 | 1.015 | -1.25% |
🧠 What This Means for Buyers
Buyers entering the Sherwood Park market this spring and summer are seeing improved opportunities.
Advantages include:
✅ More inventory to choose from
✅ Less urgency compared to previous years
✅ More balanced negotiating conditions
However:
⚠️ Prices continue to rise
⚠️ Popular neighbourhoods remain competitive
⚠️ Desirable homes still move quickly
Buyers should remain prepared with financing pre-approval and work closely with a local REALTOR® to identify opportunities as they arise.
💡 What This Means for Sellers
Sellers continue to enjoy favourable market conditions.
Positive indicators include:
✅ Rising sale prices
✅ Strong sales activity
✅ Homes still selling at or above asking price
However:
⚠️ Inventory is increasing
⚠️ Competition is growing
⚠️ Pricing strategy is becoming increasingly important
The homes that continue to perform best are those that are professionally marketed, priced accurately, and presented well.
📍 Sherwood Park Neighbourhoods Remain in Demand
Several Sherwood Park communities continue to attract strong buyer interest:
Lakeland Ridge
A favourite among families thanks to excellent schools, parks, and community amenities.
Emerald Hills
Popular for newer construction, shopping access, and convenient commuting routes.
Summerwood
An attractive option for first-time buyers and young families seeking affordability and accessibility.
Heritage Hills
Offers larger lots, mature landscaping, and a well-established community feel.
🔮 Sherwood Park Market Outlook – Summer 2026
Looking ahead, the market appears poised for continued stability through the summer months.
Key trends to watch include:
- Continued inventory growth
- Steady price appreciation
- Increased buyer activity
- Balanced negotiating conditions
If inventory growth continues to outpace sales growth, buyers may gain additional leverage later in the year. However, strong demand fundamentals should continue to support property values throughout 2026.
📞 Thinking About Buying or Selling in Sherwood Park?
Whether you're purchasing your first home, moving up, downsizing, or investing, understanding local market conditions is essential.
📲 Chris Reid
Century 21 Leading
📞 780-717-5267
🌐 chrisreidedmonton.com
Data provided by the REALTORS® Association of Edmonton and subject to change. Always consult with a real estate professional for the most current market information.
If you would like more information on the Sherwood Park real estate market contact Chris Reid
Strathcona County Website
CENTURY 21 Leading
INFO & SERVICES
CENTURY 21 Leading
14315 118 Ave NW, Unit 130, Edmonton, AB T5L4S6
(780) 455-0777
INFO & SERVICES

Independently Owned and Operated. ®/™ trademarks owned by Century 21 Real Estate LLC used under license or authorized sub-license. © 2020 Century 21 Canada Limited Partnership © 2020 Century 21 Canada Limited Partnership
The trademarks MLS®, Multiple Listing Service® and the associated logos identify professional services rendered by REALTOR® members of CREA to effect the purchase, sale and lease of real estate as part of a cooperative selling system. The trademarks REALTOR ® , REALTORS ® and the REALTOR ® logo are controlled by The Canadian Real Estate Association (CREA) and identify real estate professionals who are members of CREA. Used under license. This listing content provided by REALTOR.ca has been licensed by REALTOR® members of The Canadian Real Estate Association. Not intended to solicit properties currently listed for sale or buyers under contract.
Century 21 Canada Limited Partnership currently has franchise opportunities available in select markets across Canada. The intent of this communication is for informational purposes only and is not intended to be a solicitation to anyone under contract with another real estate brokerage operation. This e-mail message contains confidential information intended only for the use of the individual or entity named above. Any unauthorized use or disclosure is strictly prohibited. If you have received this communication in error please immediately delete the e-mail and either notify the sender at the above e-mail address or by telephone.
© 2026 MoxiWorks
