
 Facebook
 X
X
 Pinterest
 Copy Link
3747 Cross Landing Edmonton, AB T6W4X5
Uncategorized •
16 June 2022
1457 Goodspeed Lane Edmonton, AB T5T0W2
1457 Goodspeed Lane Edmonton, AB T5T0W2
This stylish and functional BROOKFIELD RESIDENTIAL HOME is 2142 square feet and features 3 bedrooms, 2.5 bathrooms and a double attached gagrage! Located in the desirable community of Parkland, located within the greater area of Glastonbury, an established west-end community. Explore the outdoors with a network of trails, pathways that connect the community. The Robson is located on an oversized pie lot and welcomes you with 10′ ceilings in the foyer, estate style curved stair case, a rear owner’s suite and beautiful Interior Designer selected finishing’s, this home also features a tandem style oversized double car garage. This home backs onto the beautiful Glastonbury park, and is currently expected to be complete for a fall possession. Lastly, for limited time only, take advantage of our full landscaping promotion on until July 1st 2022.. (photos are of show home, actual home will vary)
MLS®: E4298275
Uncategorized •
16 June 2022
Twp 540 Rge Rd 212 Rural Strathcona County, AB T8G2A2
Twp 540 Rge Rd 212 Rural Strathcona County, AB T8G2A2
This 18.29 acre lot is the perfect place for you to escape from the city! Build your forever dream home in a tranquil setting. The driveway approach, power & gas are in. This is an excellent opportunity to live country life and only 35 minutes from Edmonton.
MLS®: E4288685
Uncategorized •
16 June 2022
471 Edgemont Drive Edmonton, AB T6M1J6
471 Edgemont Drive Edmonton, AB T6M1J6
This stylish and functional BROOKFIELD RESIDENTIAL HOME is 1434 square feet and features 3 bedrooms, 2.5 bathrooms & a garage included until august 15th 2022! Located in the desirable Westside of Edmonton, Edgemont is a family friendly community complete with ravines, ponds and walking trails. This home is walking distance away from the Ravine and welcomes you with 9′ ceilings and beautiful Interior Designer selected finishing’s. Also, for a limited time only, take advantage of Brookfield’s free back landscaping promotion!! (photos are of show home, actual home will vary)
MLS®: E4288876
Edmonton Neighbourhoods •
19 May 2022
Search crime trends in neighbourhoods and city wards.
Search crime trends in neighbourhoods and city wards.
The Edmonton community safety data portal, Search crime trends in neighbourhoods and city wards. You can compare neighbourhood data and export to a spreadsheet.
Explore this interactive platform providing access to data including crime statistics and trends occurring in Edmonton neighbourhoods. It offers increased transparency into policing activities and encourages public engagement so that we may build stronger and safer communities together.
EPS hopes the Community Safety Data Portal will enable the public to take an active role in community safety and crime prevention.
To view the Community Safety Map click here.
Important Definitions
Call for Service: A citizen or police generated call that results in an event. These situations are fluid and emotionally charged and initial complainant accounts are often fractured, evolving and lacking context. Changing dynamics may result in changes in both priority of dispatch and event type over the course of a call (e.g. event type at dispatch is Trouble with Person but changes to an event type of Assault upon arrival and evaluation by an EPS member).
Occurrence: An incident or a series of connected incidents reported to police that results in the creation of a police report. An occurrence can be criminal requiring investigation or non-criminal requiring follow-up.
Edmonton Real Estate Market Trends and Insights •
2 March 2022
Residential Statistics City of Edmonton February 2022
RESIDENTIAL STATISTICS CITY OF EDMONTON February 2022
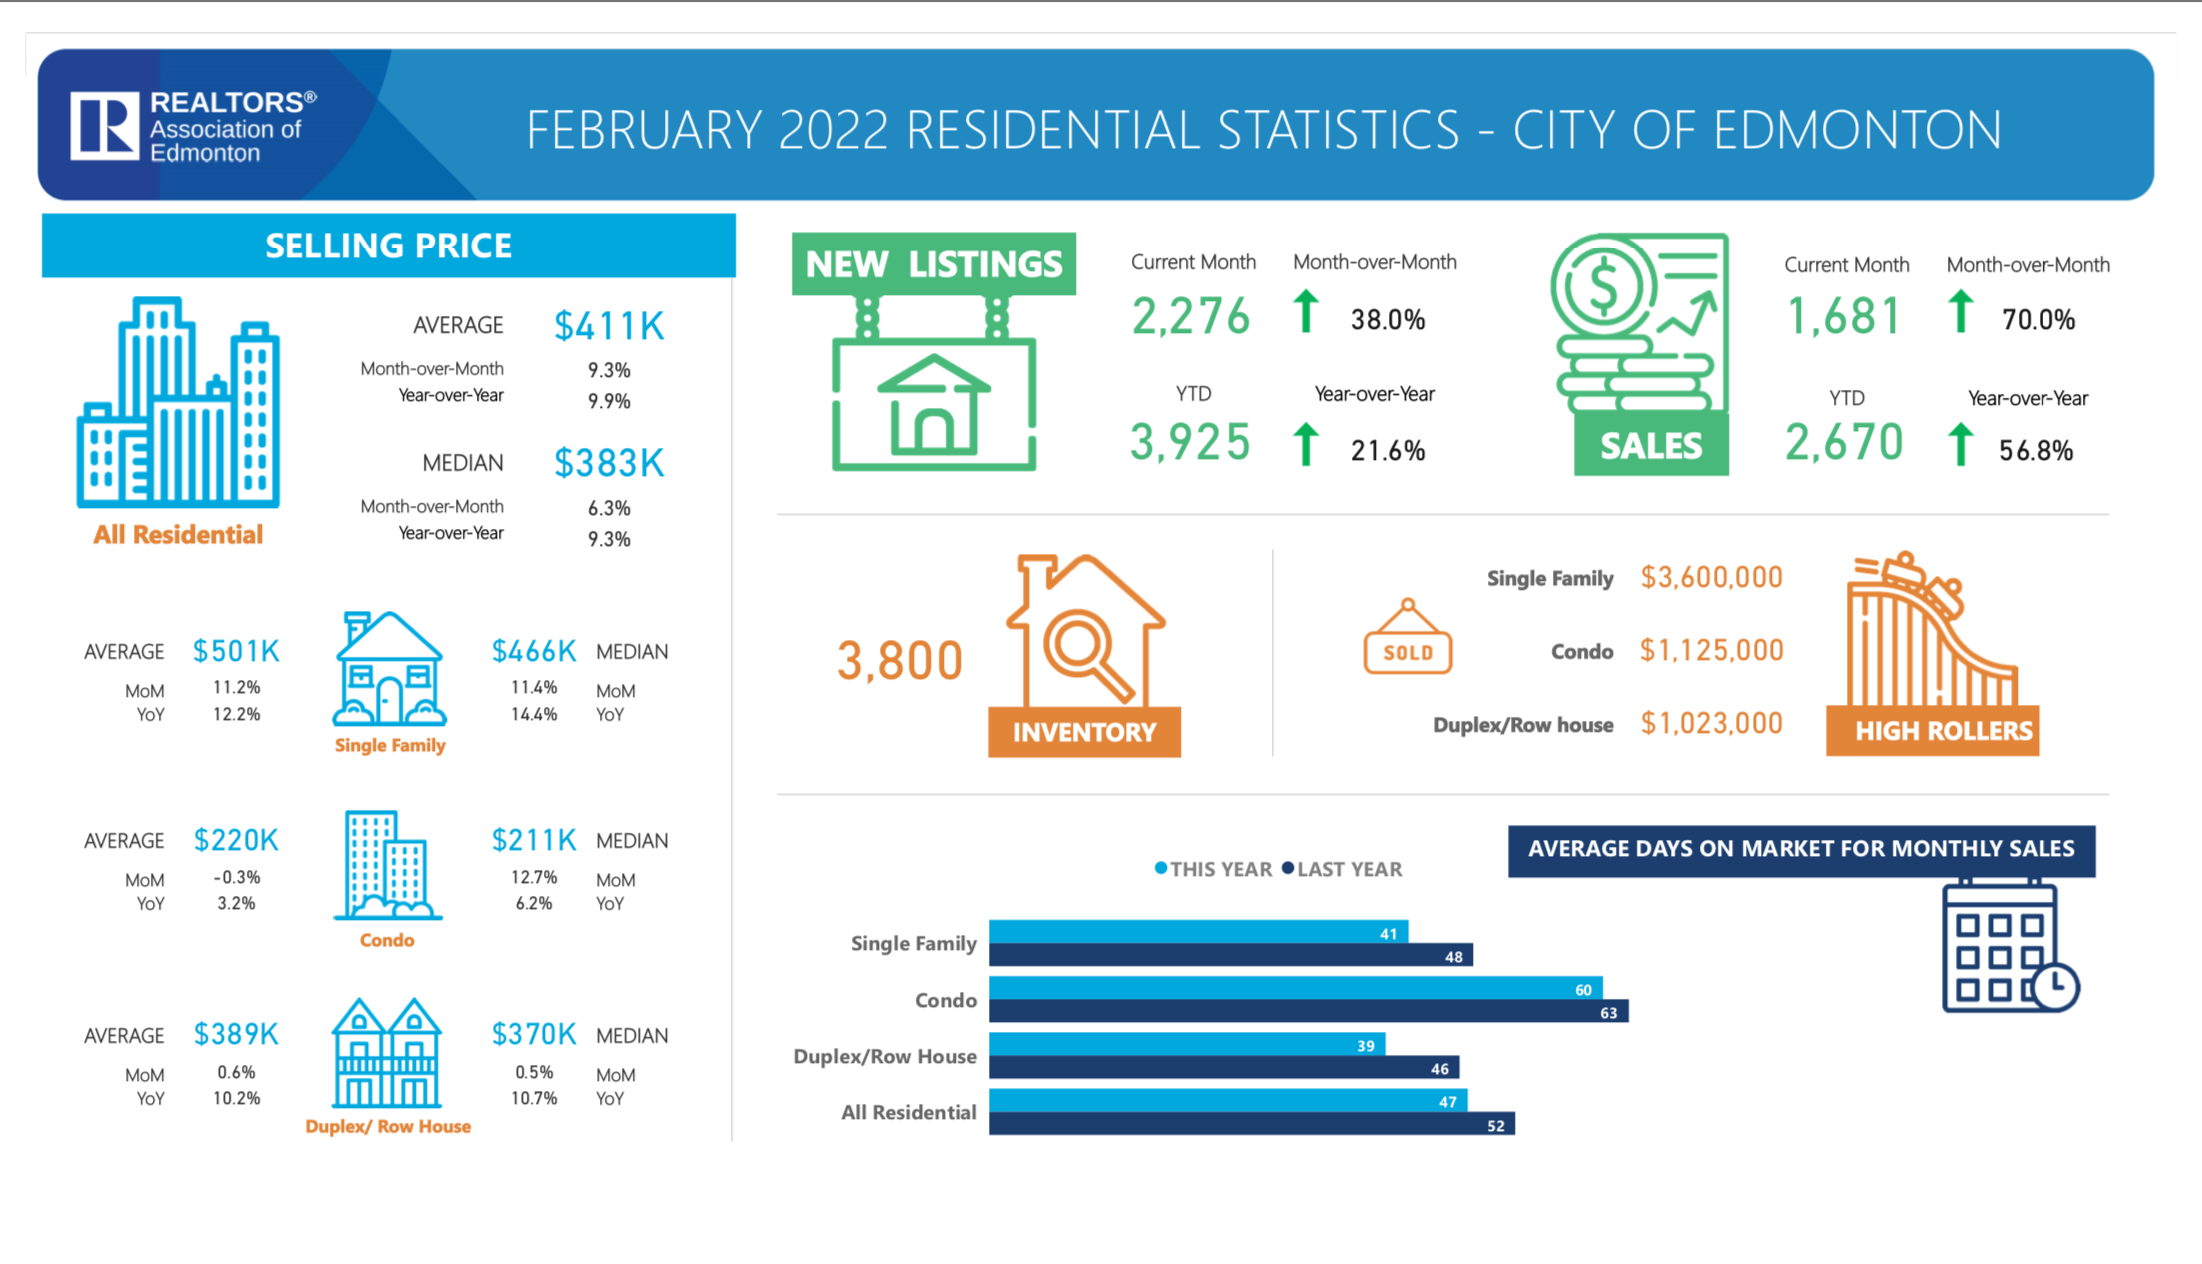
The REALTORS® Association of Edmonton has released the February 2022 Residential Statistics – City of Edmonton. The Edmonton Home Market is in high demand as inventory levels fall dramatically! Residential home sales in February of 2022 went up 56.8% (609) homes from February 2021. Average home sale price was $410,508. Prices saw an increase of $37,096 from last February that’s an increase of 3.2% year-over-year. Average days on market is sitting at 47 days.
New listings for the month of February came in at 2276 up 21.6% from last year.
The selling price of single family home is at $501,425 up 12.2% from last year and had 1000 sales. Duplexes and row housing sold 223 homes, with prices up 10.2% to an average of $389,152. 428 Condos sold at an increase in price of 3.2% to an average of $220,066.
MORTGAGE QUALIFICATION CHANGES
The Bank of Canada has raised its key interest rate for the first time since slashing the benchmark rate to near-zero at the start of the COVID-19 pandemic, in a bid to tackle inflation rates that are likely to keep rising from their current three-decade high.
The central bank increased its key rate by a quarter of a percentage point to 0.5 per cent on Wednesday in a bid to help fight inflation, which is at its highest level since 1991.
The move prompted Royal Bank and TD to raise their prime lending rates — and other big banks were expected to follow — to increase the cost of loans such as variable-rate mortgages that are linked to the central bank’s benchmark rate.
According to Ratehub.ca’s calculations, a household with an annual income of $100,000 and a 20 percent down payment – with a 5-year fixed mortgage rate of 1.78 percent amortized over 30 years – would qualify for a home valued at $651,000 under today’s 4.79 percent qualifying rate. Under the new stress test rate of 5.25 percent, the same household’s maximum affordability would decrease to $618,000. That’s a difference of $33,000 (or 5 percent).
READY TO MAKE A MOVE
Looking to make a move in Edmonton’s housing market? CLICK HERE to get a free home evaluation. Start home search by CLICKING HERE.
Not ready to make a move but curious what’s happening in the market in your neighbourhood? CLICK HERE to sign up for neighbourhood news. Get updates on the current listings, sales and real estate trends in your neighbourhood.
February 2022 Residential Statistics City of Edmonton. Click Image for Full Report.
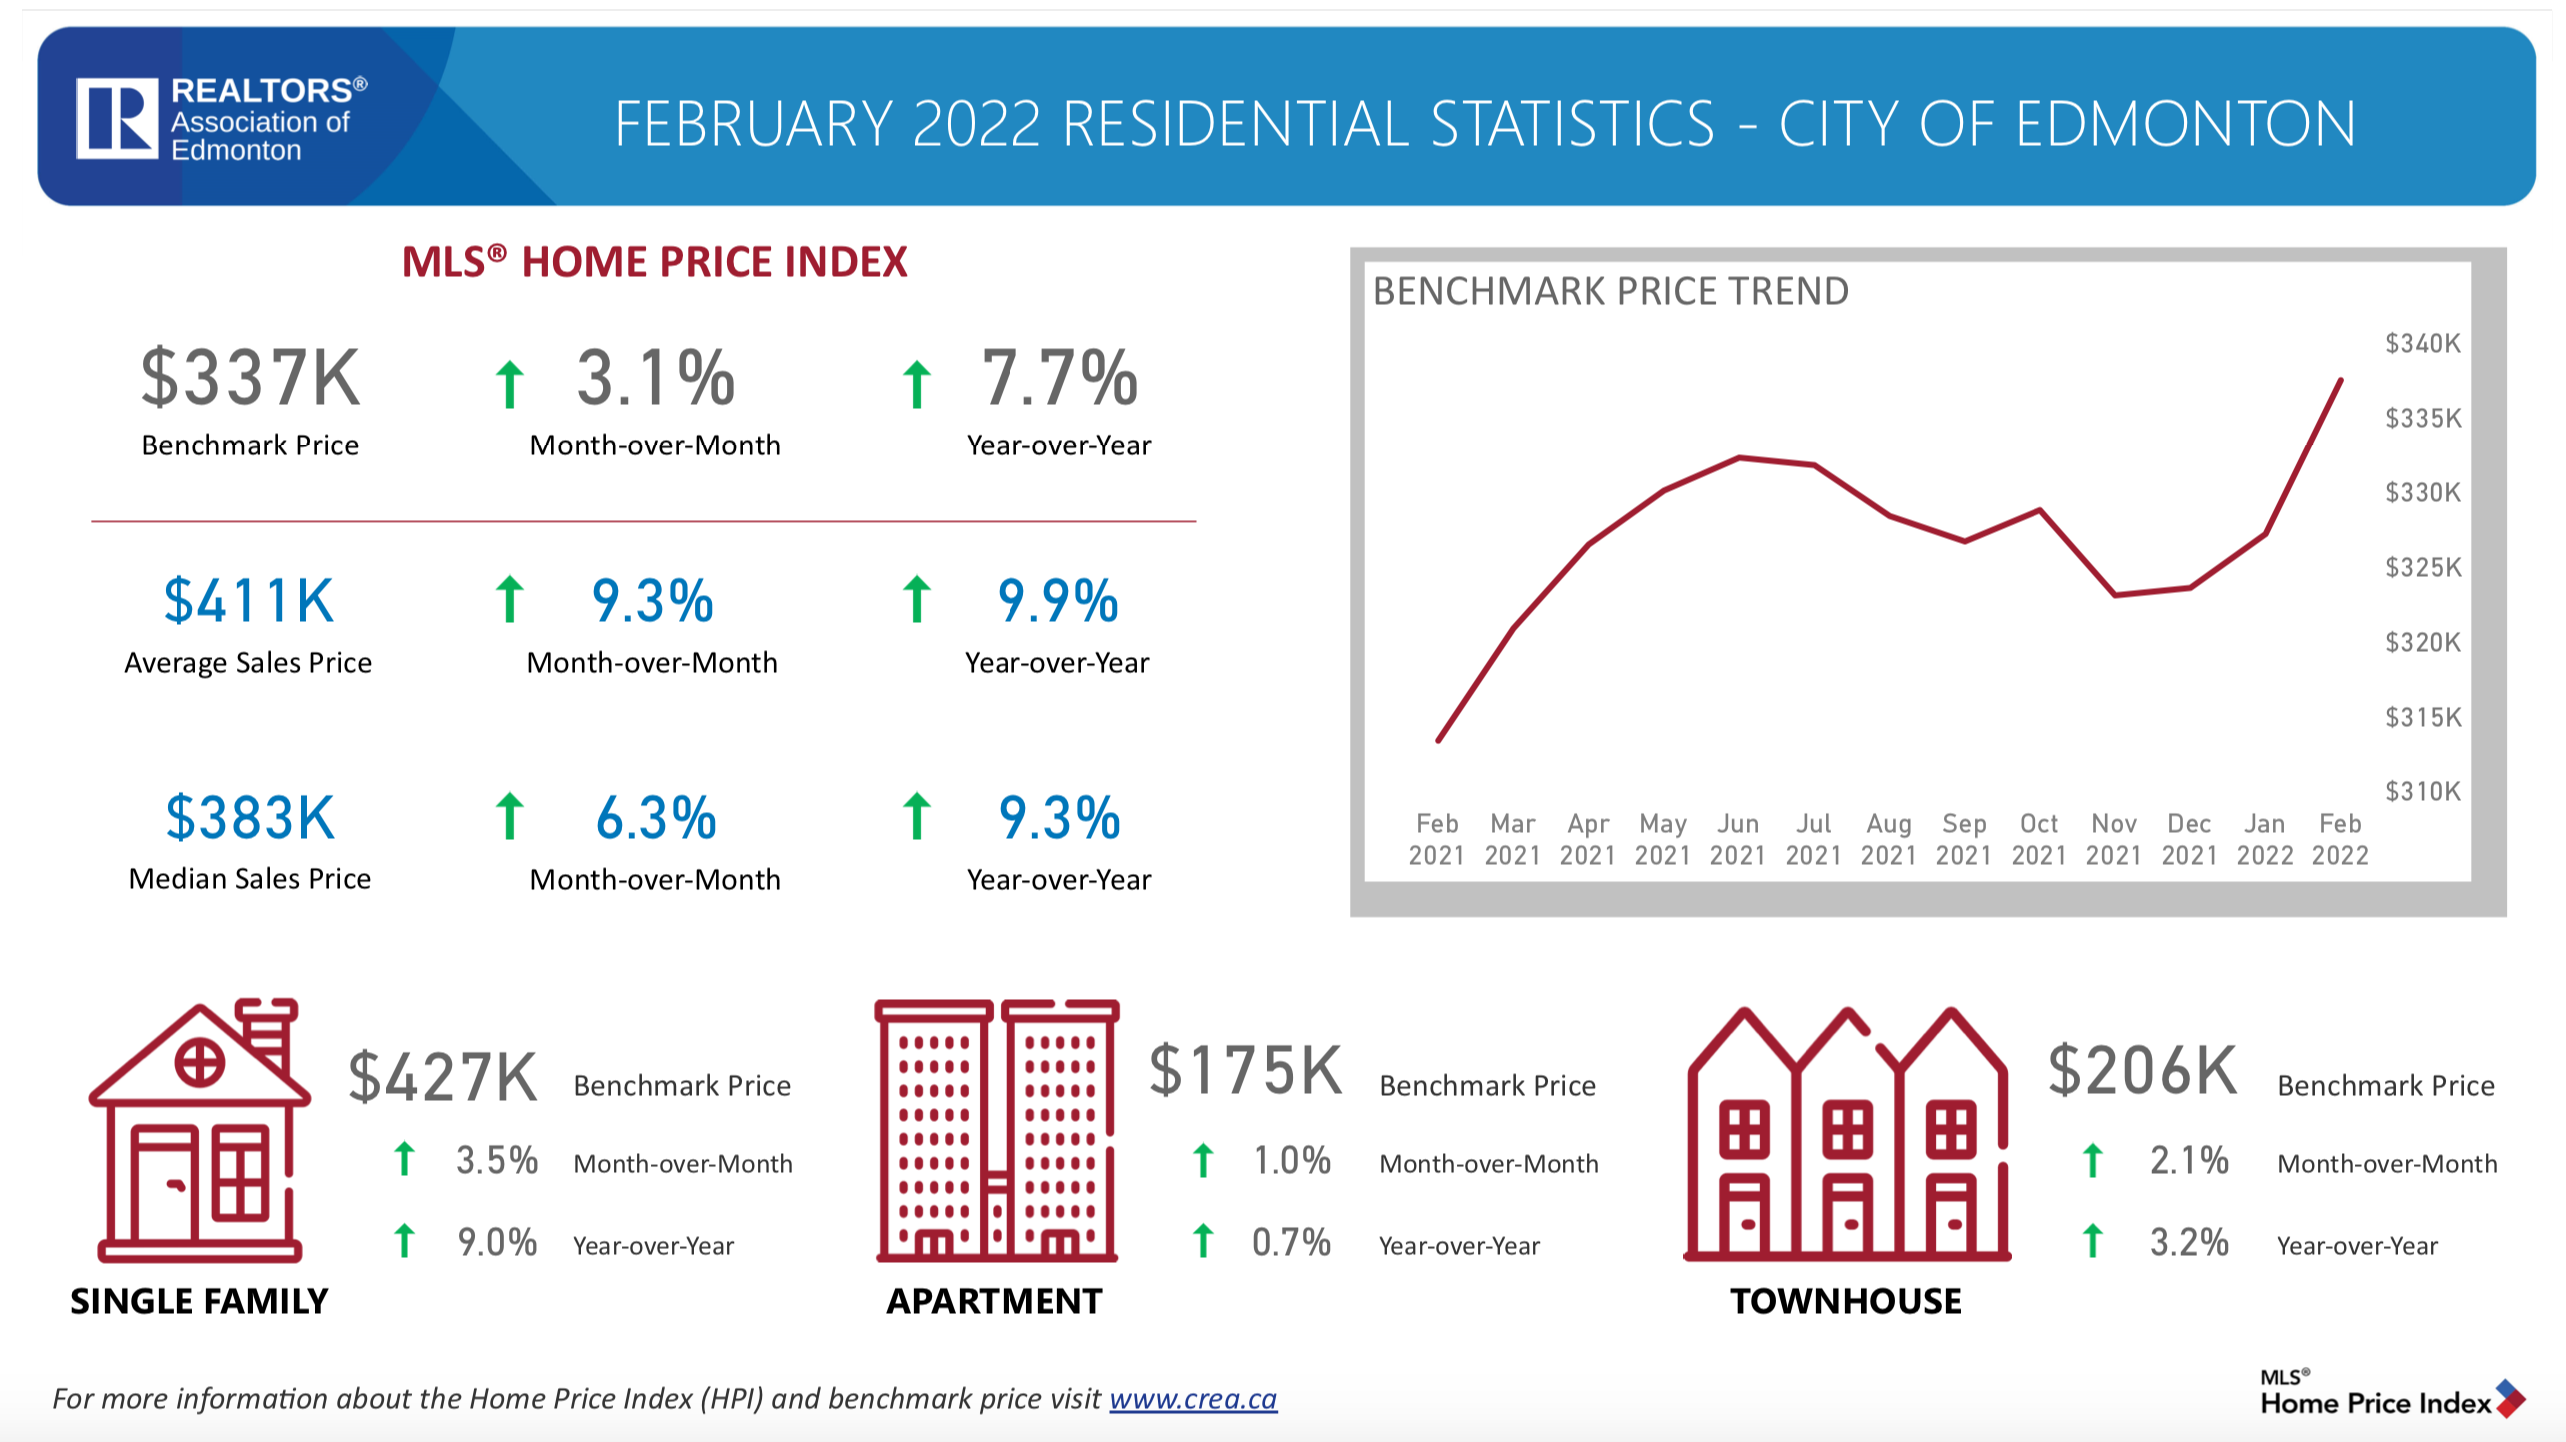
February 2022 Residential Statistics City of Edmonton MLS® Home Price Index
For more information on the Canadian Real Estate Associations MLS® Home Price Index CLICK HERE
Edmonton Real Estate Market Trends and Insights •
2 March 2022
Residential Statistics City of Edmonton January 2022
RESIDENTIAL STATISTICS CITY OF EDMONTON January 2022
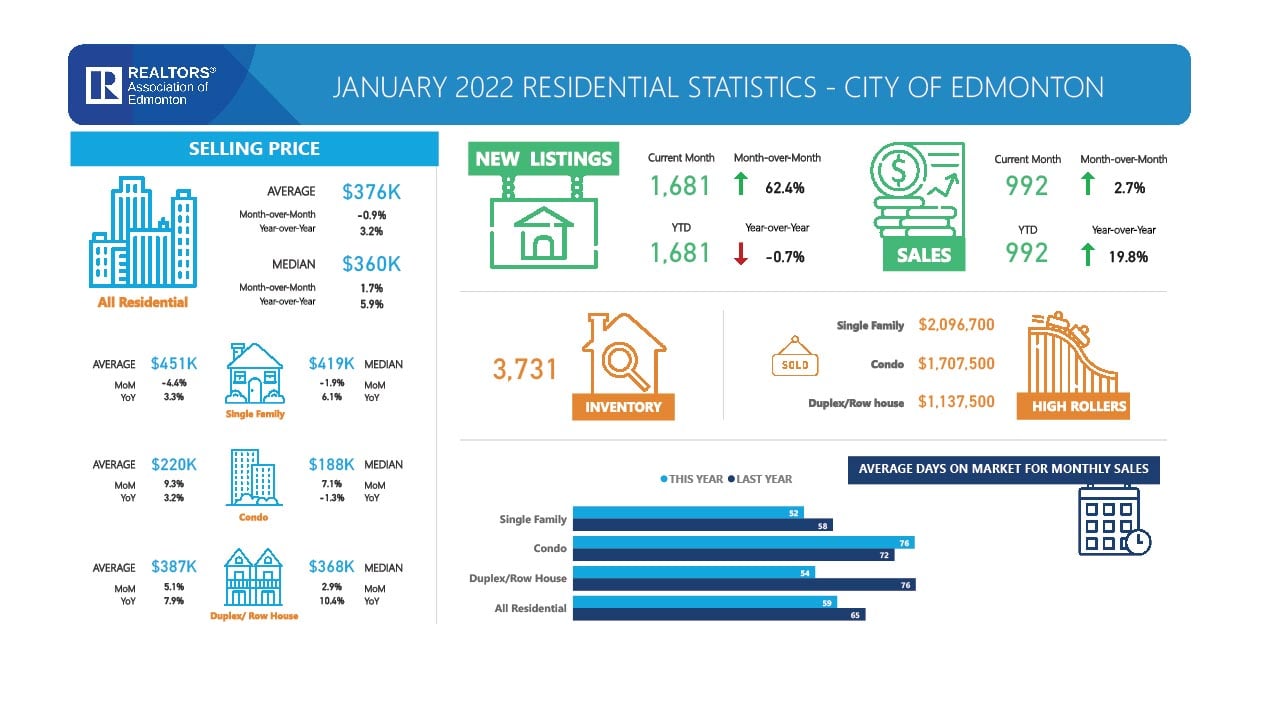
The REALTORS® Association of Edmonton has released the January 2022 Residential Statistics – City of Edmonton. The Edmonton Home Market is HOT as inventory levels fall dramatically! Residential home sales in January of 2022 went up 19.8% (164) homes from January 2021. Average home sale price was $375,538. Prices saw an increase of $11,713 from last January that’s an increase of 3.2% year-over-year. Average days on market is sitting at 59 days.
New listings for the month of January came in at 1682 down 11 homes from last year.
The selling price of single family home is at $451,054 up 3.3% from last year and had 576 sales. Duplexes and row housing sold 124 homes, with prices up 7.9% to an average of $368,792. Condos sold at an increase in price of 3.2% to an average of $220,478.
MORTGAGE QUALIFICATION CHANGES
Mortgage rate forecast for Q4 2021: Inflation is expecting the mortgage rates to get pushed up. The markets are anticipating the Bank of Canada will raise interest rates six times in 2022, starting in March. Those that are prequalified on their mortgage approval are seeking to get into the market before interest rates go up. New mortgage qualification rules went into effect June 1, 2021. The new minimum qualifying rate for uninsured mortgages will be the contracted rate plus 2 percent or 5.25 percent – whichever is higher. That’s up from the current qualifying rate of 4.79 percent.
According to Ratehub.ca’s calculations, a household with an annual income of $100,000 and a 20 percent down payment – with a 5-year fixed mortgage rate of 1.78 percent amortized over 30 years – would qualify for a home valued at $651,000 under today’s 4.79 percent qualifying rate. Under the new stress test rate of 5.25 percent, the same household’s maximum affordability would decrease to $618,000. That’s a difference of $33,000 (or 5 percent).
READY TO MAKE A MOVE
Looking to make a move in Edmonton’s housing market? CLICK HERE to get a free home evaluation. Start home search by CLICKING HERE.
Not ready to make a move but curious what’s happening in the market in your neighbourhood? CLICK HERE to sign up for neighbourhood news. Get updates on the current listings, sales and real estate trends in your neighbourhood.
January-2022-Residential-Statistics-City-of-Edmonton
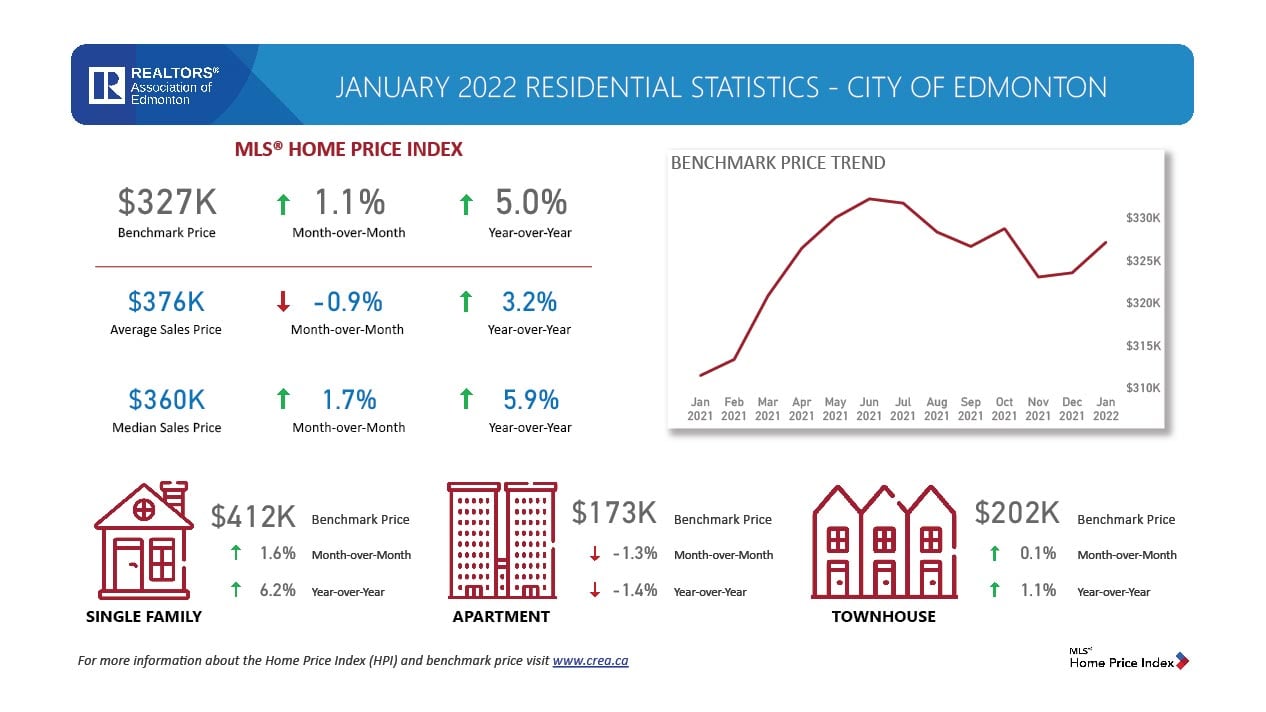
January 2022 Residential Statistics- City of Edmonton MLS® Home Price Index
For more information on the Canadian Real Estate Associations MLS® Home Price Index CLICK HERE
Edmonton Real Estate Market Trends and Insights •
2 March 2022
Residential Statistics City of Edmonton December 2021
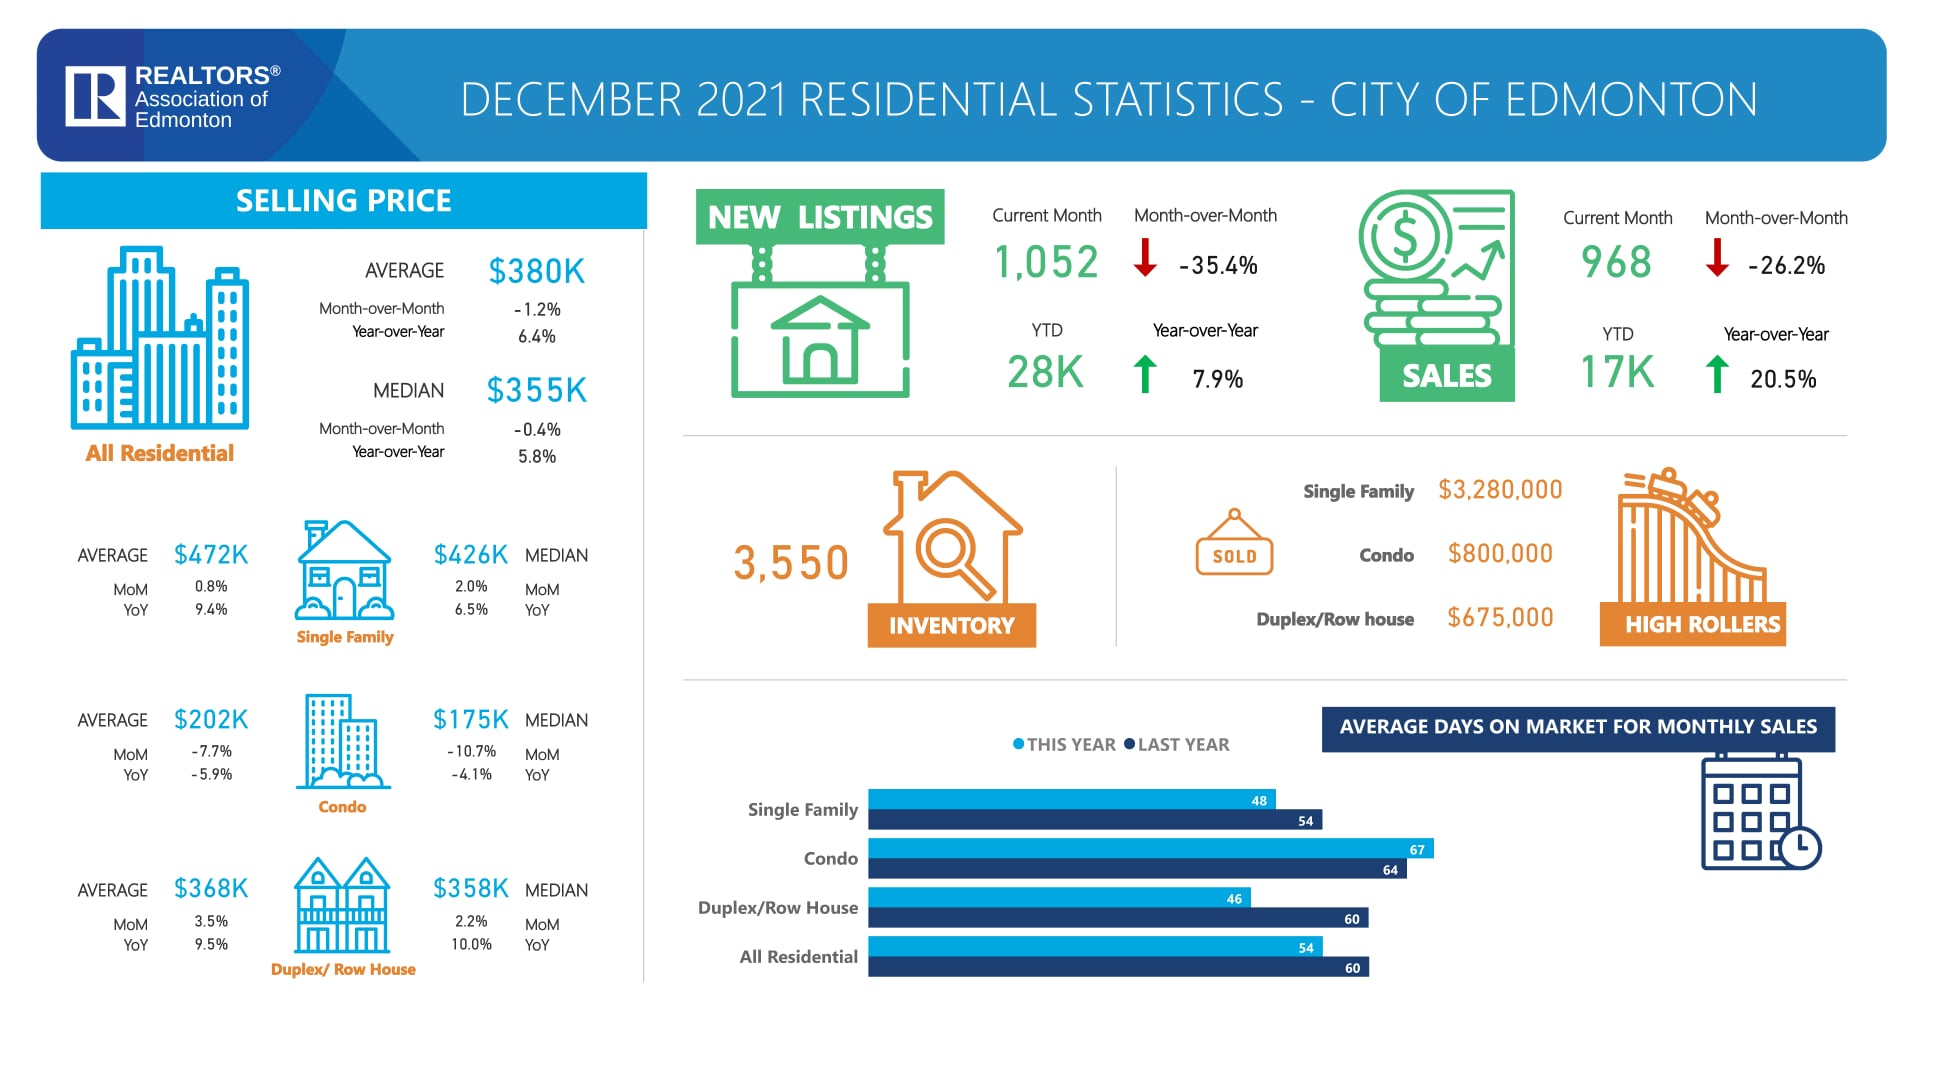
RESIDENTIAL STATISTICS CITY OF EDMONTON December 2021
The REALTORS® Association of Edmonton has released the December 2021 Residential Statistics – City of Edmonton. Home sales in Edmonton were up significantly to same time last year. 968 residential home sales in December of 2021 up 20.5% (165) homes from December 2020. Average home sale price was $379,860. Prices saw an increase of $22,948 from last December that’s an increase of 6.4% year-over-year. Average days on market is sitting at 54 days.
New listings for the month of December came in at 1053 up 137 homes from last year.
The selling price of single family home is at $471,705 up 9.4% from last year. Duplexes and row housing prices are up 9.5% to an average of $368,041. Condo sales saw a decrease in price of -5.9% to an average of $201,752.
MORTGAGE QUALIFICATION CHANGES
Mortgage rate forecast for Q4 2021: Inflation is expecting the mortgage rates to get pushed up. The markets are anticipating the Bank of Canada will raise interest rates six times in 2022, starting in March. Those that are prequalified on their mortgage approval are seeking to get into the market before interest rates go up. New mortgage qualification rules went into effect June 1, 2021. The new minimum qualifying rate for uninsured mortgages will be the contracted rate plus 2 percent or 5.25 percent – whichever is higher. That’s up from the current qualifying rate of 4.79 percent.
According to Ratehub.ca’s calculations, a household with an annual income of $100,000 and a 20 percent down payment – with a 5-year fixed mortgage rate of 1.78 percent amortized over 30 years – would qualify for a home valued at $651,000 under today’s 4.79 percent qualifying rate. Under the new stress test rate of 5.25 percent, the same household’s maximum affordability would decrease to $618,000. That’s a difference of $33,000 (or 5 percent).
READY TO MAKE A MOVE
Looking to make a move in Edmonton’s housing market? CLICK HERE to get a free home evaluation. Start home search by CLICKING HERE.
Not ready to make a move but curious what’s happening in the market in your neighbourhood? CLICK HERE to sign up for neighbourhood news. Get updates on the current listings, sales and real estate trends in your neighbourhood.
December 2021 Residential Statistics City of Edmonton Click Photo For Full Report.
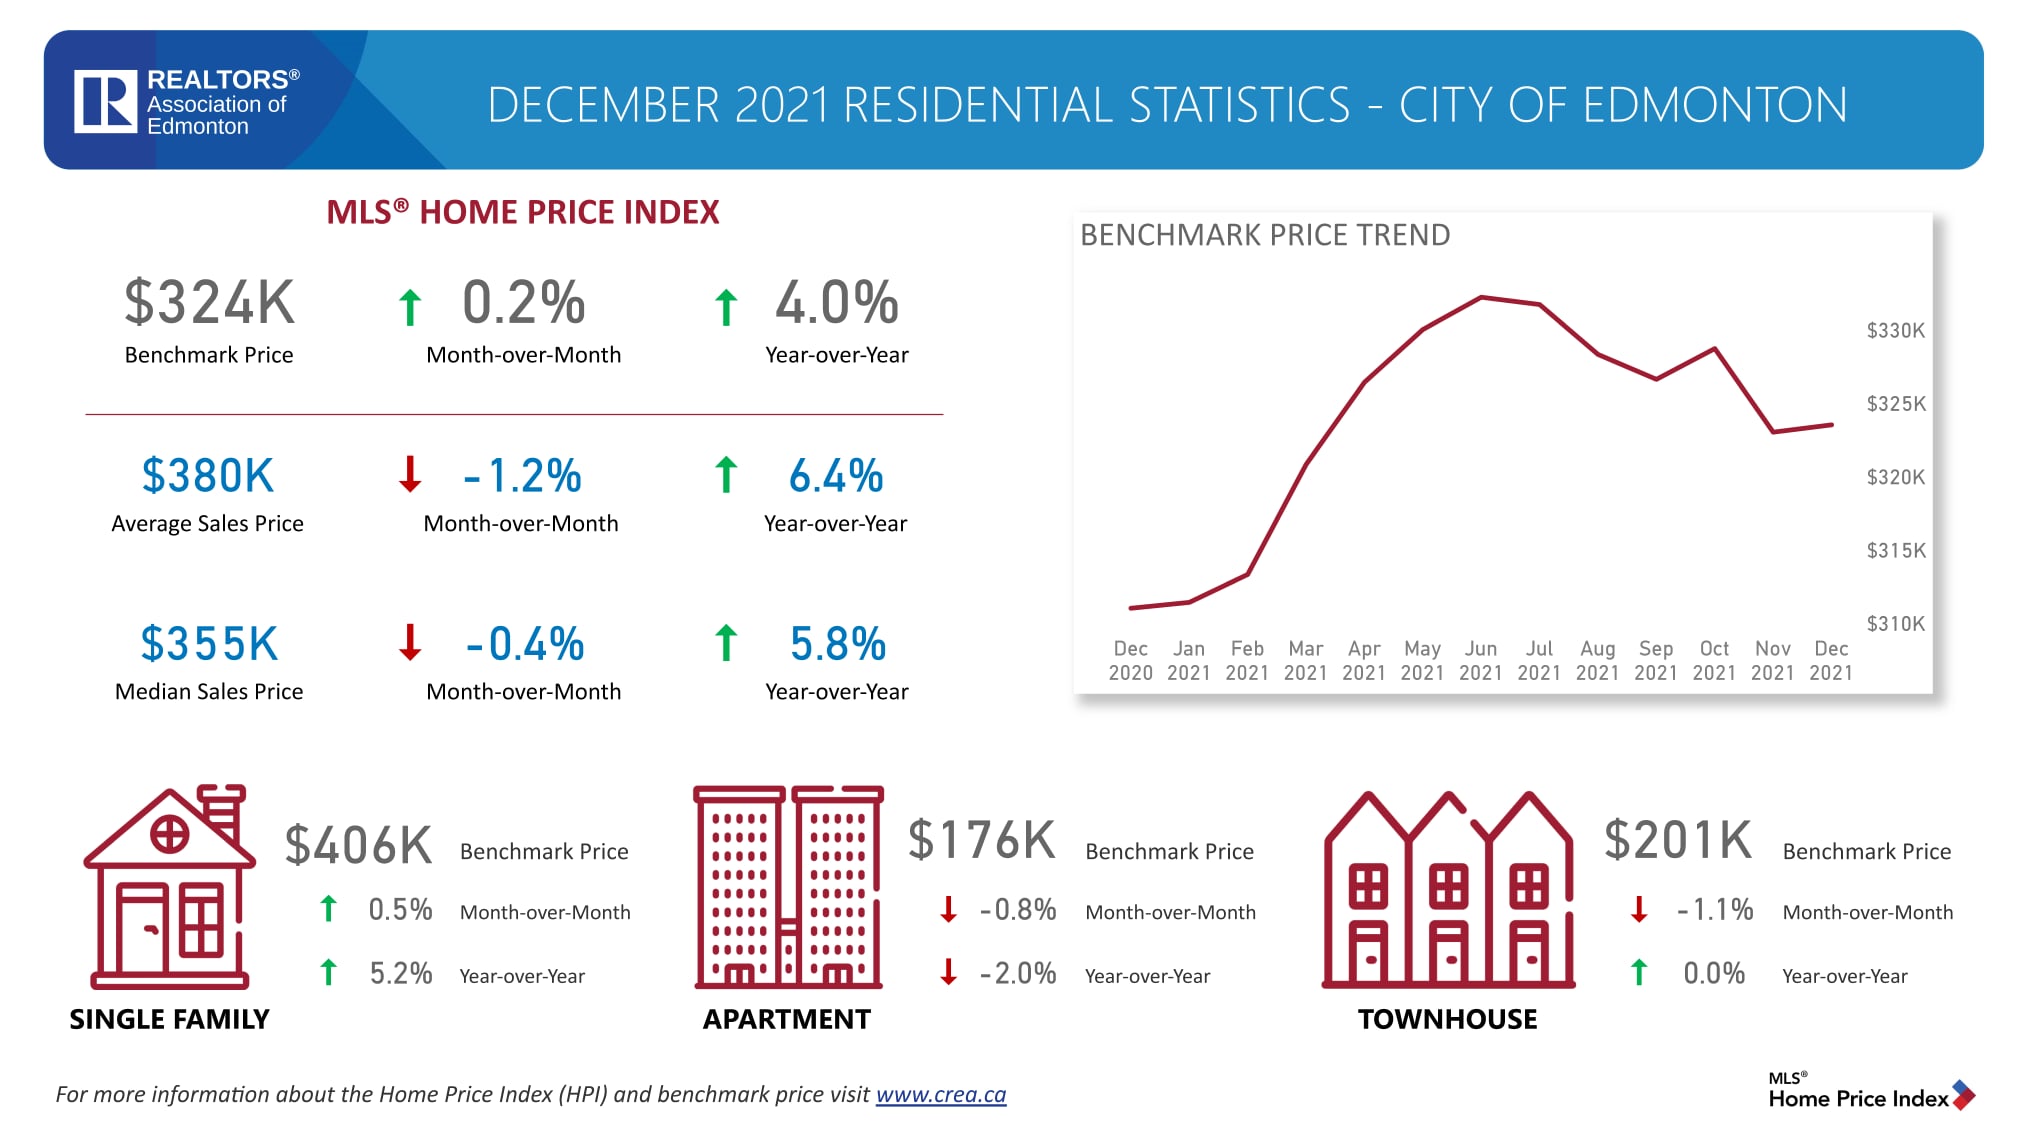
December 2021 Residential Statistics- City of Edmonton MLS®Home Price Index
For more information on the Canadian Real Estate Associations MLS® Home Price Index CLICK HERE
Edmonton Guidelines & Programs •
28 February 2022
Home Renovation Return on Investment Guide
Home Renovation Return on Investment Guide
Considering renovations to your home prior to selling? Check out this 2019 Home Renovation, Return on Investment Guide provided by Harrison Browker Valuation Group.
| *Based on a 3 bedroom home, fully finished basement, 6000sqft lot, middle-income neighbourhood, home with front and rear doors and rear patio door, Approximately 11 windows. The costs assume professional installation however Contractor pricing can vary. Individual rates of return will vary from project to project and as the real estate market changes. | ||
| Top Renovations | ||
|---|---|---|
| Kitchen | Best return on investment when considering functionality | |
| Paint | Least expensive renovation with the best return – home interior | |
| Asphalt roof | Best return – home exterior | |
| Tank-less on-demand water heater | Best return – electrical, mechanical, plumbing | |
| Fence (pressure treated) | Best return – landscaping | |
| Double-detached garage (heated) | Best return – garages, sunrooms, additions | |
| Top 5 Renovation Regrets | ||
| Not having a well-planned design and a reasonable time frame. | ||
| Not budgeting for unforseen costs or changes to the plan. | ||
| Not getting a complete quote in writing or having a full understanding of the quote given. | ||
| Not hiring a professional for jobs that require the expertise. | ||
| Not planning renovations in terms of resale. | ||
| Home Interiors | ||
| Renovation | Cost Range | % Return |
| Interior Painting | $3000-$5000 | 80-110% |
| New Flooring | ||
| Hardwood | $9-$13/sqft | 60-80% |
| Laminate | $5-9/sqft | 60-80% |
| Ceramic Tile | $7.50-8.75/sqft | 60-80% |
| Porcelain Tile | $9-11/sqft | 50-65% |
| Slate | $13-14/sqft | 50-65% |
| Carpet & Pad | $2.75-4.50/sqft | 60-80% |
| Sheet Vinyl | $2.75-4.50/sqft | 60-80% |
| Luxury Vinyl Tile (LVT) | $3.75-7.50/sqft | 60-80% |
| Cork | $7.50-10/sqft | 25-45% |
| Removal and Disposal | $.25-.50/sqft | |
| Remodel 4pc Bathroom | ||
| New fixtures, vanity, tub, shower & flooring | $10,000-20,000 and up | 50-75% |
| Remodel Kitchen- Cabinets, flooring, countertop, appliances and lighting | ||
| Average quality | $15,000-$30,000 and up | 75-95% |
| High quality | $40,000-70,000 and up | 40-60% |
| Basement Redevelopment | ||
| Drywall finish, paint, 3 piece bathroom, 2 bedrooms, family room, carpet, vinyl, drop ceiling tile | $35,000-50,000 | 50-75% |
| $30-45/sqft | ||
| Gas Fireplace | ||
| Average Quality | $2,500-5,000 | 45-70% |
| High Quality | $5,000-$10,000 | 25-50% |
| Seniors Walk-In Tub | $7500+ | 0-25% |
| Home Exteriors | ||
| Renovation | Cost Range | % Return |
| Siding | ||
| New Stucco Application | $17,000-21,000 | 25-45% |
| Premium Vinyl Siding | $10,000-12,000 | 50-75% |
| Standard Vinyl Siding | $8,000-10,000 | 50-75% |
| Hardieplank | $11,000-13,000 | 50-75% |
| Artificial Masonry/Cultured Stone | $12-15/sqft | 25-45% |
| Brick Façade | $35-40/sqft | 20-35% |
| Soffits & Fascia | $4,000-$6,000 | 25-45% |
| 5″ Seamless Eavestroughs | $7-9/ft | 25-45% |
| 6″ Seamless Eavestroughs | $11-15/ft | 25-45% |
| Roof | ||
| Asphalt (25-30 years/ $3-4/sqft) | $4,000-5000 | 75-95% |
| Rubber (50 years/ $6-8/sqft) | $8,000-9000 | 50-75% |
| Cedar Shakes (30-40 years/ $5-10/sqft) | $15,000-20,000 | 50-75% |
| Metal (50 years/ $9-13/sqft) | $15,000-20,000 | 50-75% |
| Reinsulate attic | $1,400-1500 | 25-35% |
| Standard Doors (Single) | ||
| Exterior (basic insulated, metal clad, embossed panels, half moon window) | $1,500-2,000 | 50-75% |
| Interior (hollow core) | $300-600 | 50-75% |
| Deluxe Doors (Single) | ||
| Exterior (including upgraded hardware and sidelights) | $3,000-4000+ | 50-75% |
| Interior | $600-1,000 | 50-75% |
| Replace Sliding Patio Door- PVC (72″x 80″) | $1,500-2,500 | 50-75% |
| Windows | ||
| Double Pane, Vinyl Casement, 1 Bay | $10,000-13,000 | 75-90% |
| Low-E, Triple Pane, Vinyl Casement, 1 Bay | $11,000-14,000 | 75-90% |
| Skylight (Basic) | ||
| Triple Glaze, Standard Roof | $800-1,500 | 15-30% |
| Solar Tubes (New Install) | $700-1,000 | 15-30% |
| Electrical, Mechanical & Plumbing | ||
| Renovation | Cost Range | % Return |
| Central Vacuum | $1,300-1,500 | 30-60% |
| Alarm System | ||
| Monthly Monitoring | $25 and up | 0-10% |
| Hot Water Tank | ||
| Mid-efficiency, natural draft (40-50 imperial gallons) | $1,000-1,200 | 50-75% |
| High-efficiency, power direct vent (40-50 imperial gallons) | $1,500-2,000 | 60-80% |
| Tankless On-Demand | $8,000-10,000 | 65-85% |
| Water Treatment | ||
| Water Conditioner | $2,300-4000 | 25-50% |
| Reverse Osmosis Drinking System | $1,500-2,000 | 25-50% |
| Soffits & Fascia | $4,000-6,000 | 25-45% |
| HVAC | ||
| Air Conditioning | $3,000-6,000 | 40-60% |
| New Furnace (high efficiency) | $5,000-8,000 | 80% |
| Geothermal Retrofit (with furnace) | $30,000+ | 25-40% |
| Electrical Service Upgrade | ||
| 60-100Amps | $5,000-6,000 | 40-60% |
| Solar Panel Retrofit (rooftop) | $15,000-30,000 | 40-70% |
| Plumbing Lines (Copper to Pex) | $3,000-6,000 | 25-50% |
| Garages, Sunrooms, Additions | ||
| Renovation | Cost Range | % Return |
| New 24’x24′ Double Detached garage (heated, insulated, slab) | $25,000-35,000 | 60-80% |
| New 24’x24′ Garage with Secondary Suite | $125,000-175,000 | 40-60% |
| Renovate Older 24’x24′ garage with new insualtion, drywalll, insulated garage door & heater | $8,000-12,000 | 25-40% |
| New 3-season 10’x15′ Sunroom Addition | $15,000-25,000 | 50-75% |
| New 4-season 10’x15′ Sunroom Addition | $25,000-35,000 | 50-75% |
| 300sqft Family Room Addition (no basement, vaulted ceilings, gas fireplace, hardwood flooring, exterior to match) | $60,000-90,000 | 30-50% |
| Landscaping | ||
| Renovation | Cost Range | % Return |
| Ponds, Fountains, & Rocks (Wide Variance) | (varies widely) | 10-30% |
| Driveways & Hard Surfaces | ||
| Remove/Repour Concrete | $12-14/sqft | 25-45% |
| Replace Concrete With Paving Stone or Brick | $18-20/sqft | 10-50% |
| Add Stamped or Exposed Aggregate Finish | $3-4/sqft | 10-20% |
| Raised Deck 12’x20′ (Screw Pile Foundation) | ||
| Pressure Treated Wood | $40/sqft | 50-75% |
| Cedar | $45/sqft | 50-75% |
| Composite | $75-85/sqft | 50-75% |
| Vinyl | $75-85/sqft | 50-75% |
| Railing (Aluminum) | $45-50/ft | 50-75% |
| Railing (PVC) | $75/ft | 50-75% |
| Pergola (Cedar) | $20-28/sqft | 0-25% |
| Pergola (Maintenance Free) | $75/sqft | 0-25% |
| Underground Sprinkler System (Front & Back) | $4,000-5,000 | 20-50% |
| Fencing & Curbing | ||
| Pressure Treated Wood (6′) (add gate $250+/-) | $38-45/linear ft | 60-75% |
| Ornamental Aluminum (4′) | $35-45/linear ft | 50-75% |
| Vinyl (6′) | $45-55/linear ft | 50-75% |
| Chain Link (Galvanized or Coated) (6′) | $12-25/linear ft | 50-75% |
| Concrete Curbing | $5-8/sqft | 10-25% |
| Tree Removal (eg 35′ Spruce Tree) | $700-800 | 0-10% |
| Sod Replacement | $2-3/sqft | 25-50% |
| Outdoor Hot Tub Jacuzzi | $7,000-10,000 and up | 5-40% |
Edmonton Real Estate Market Trends and Insights •
6 December 2021
Residential Statistics City of Edmonton November 2021
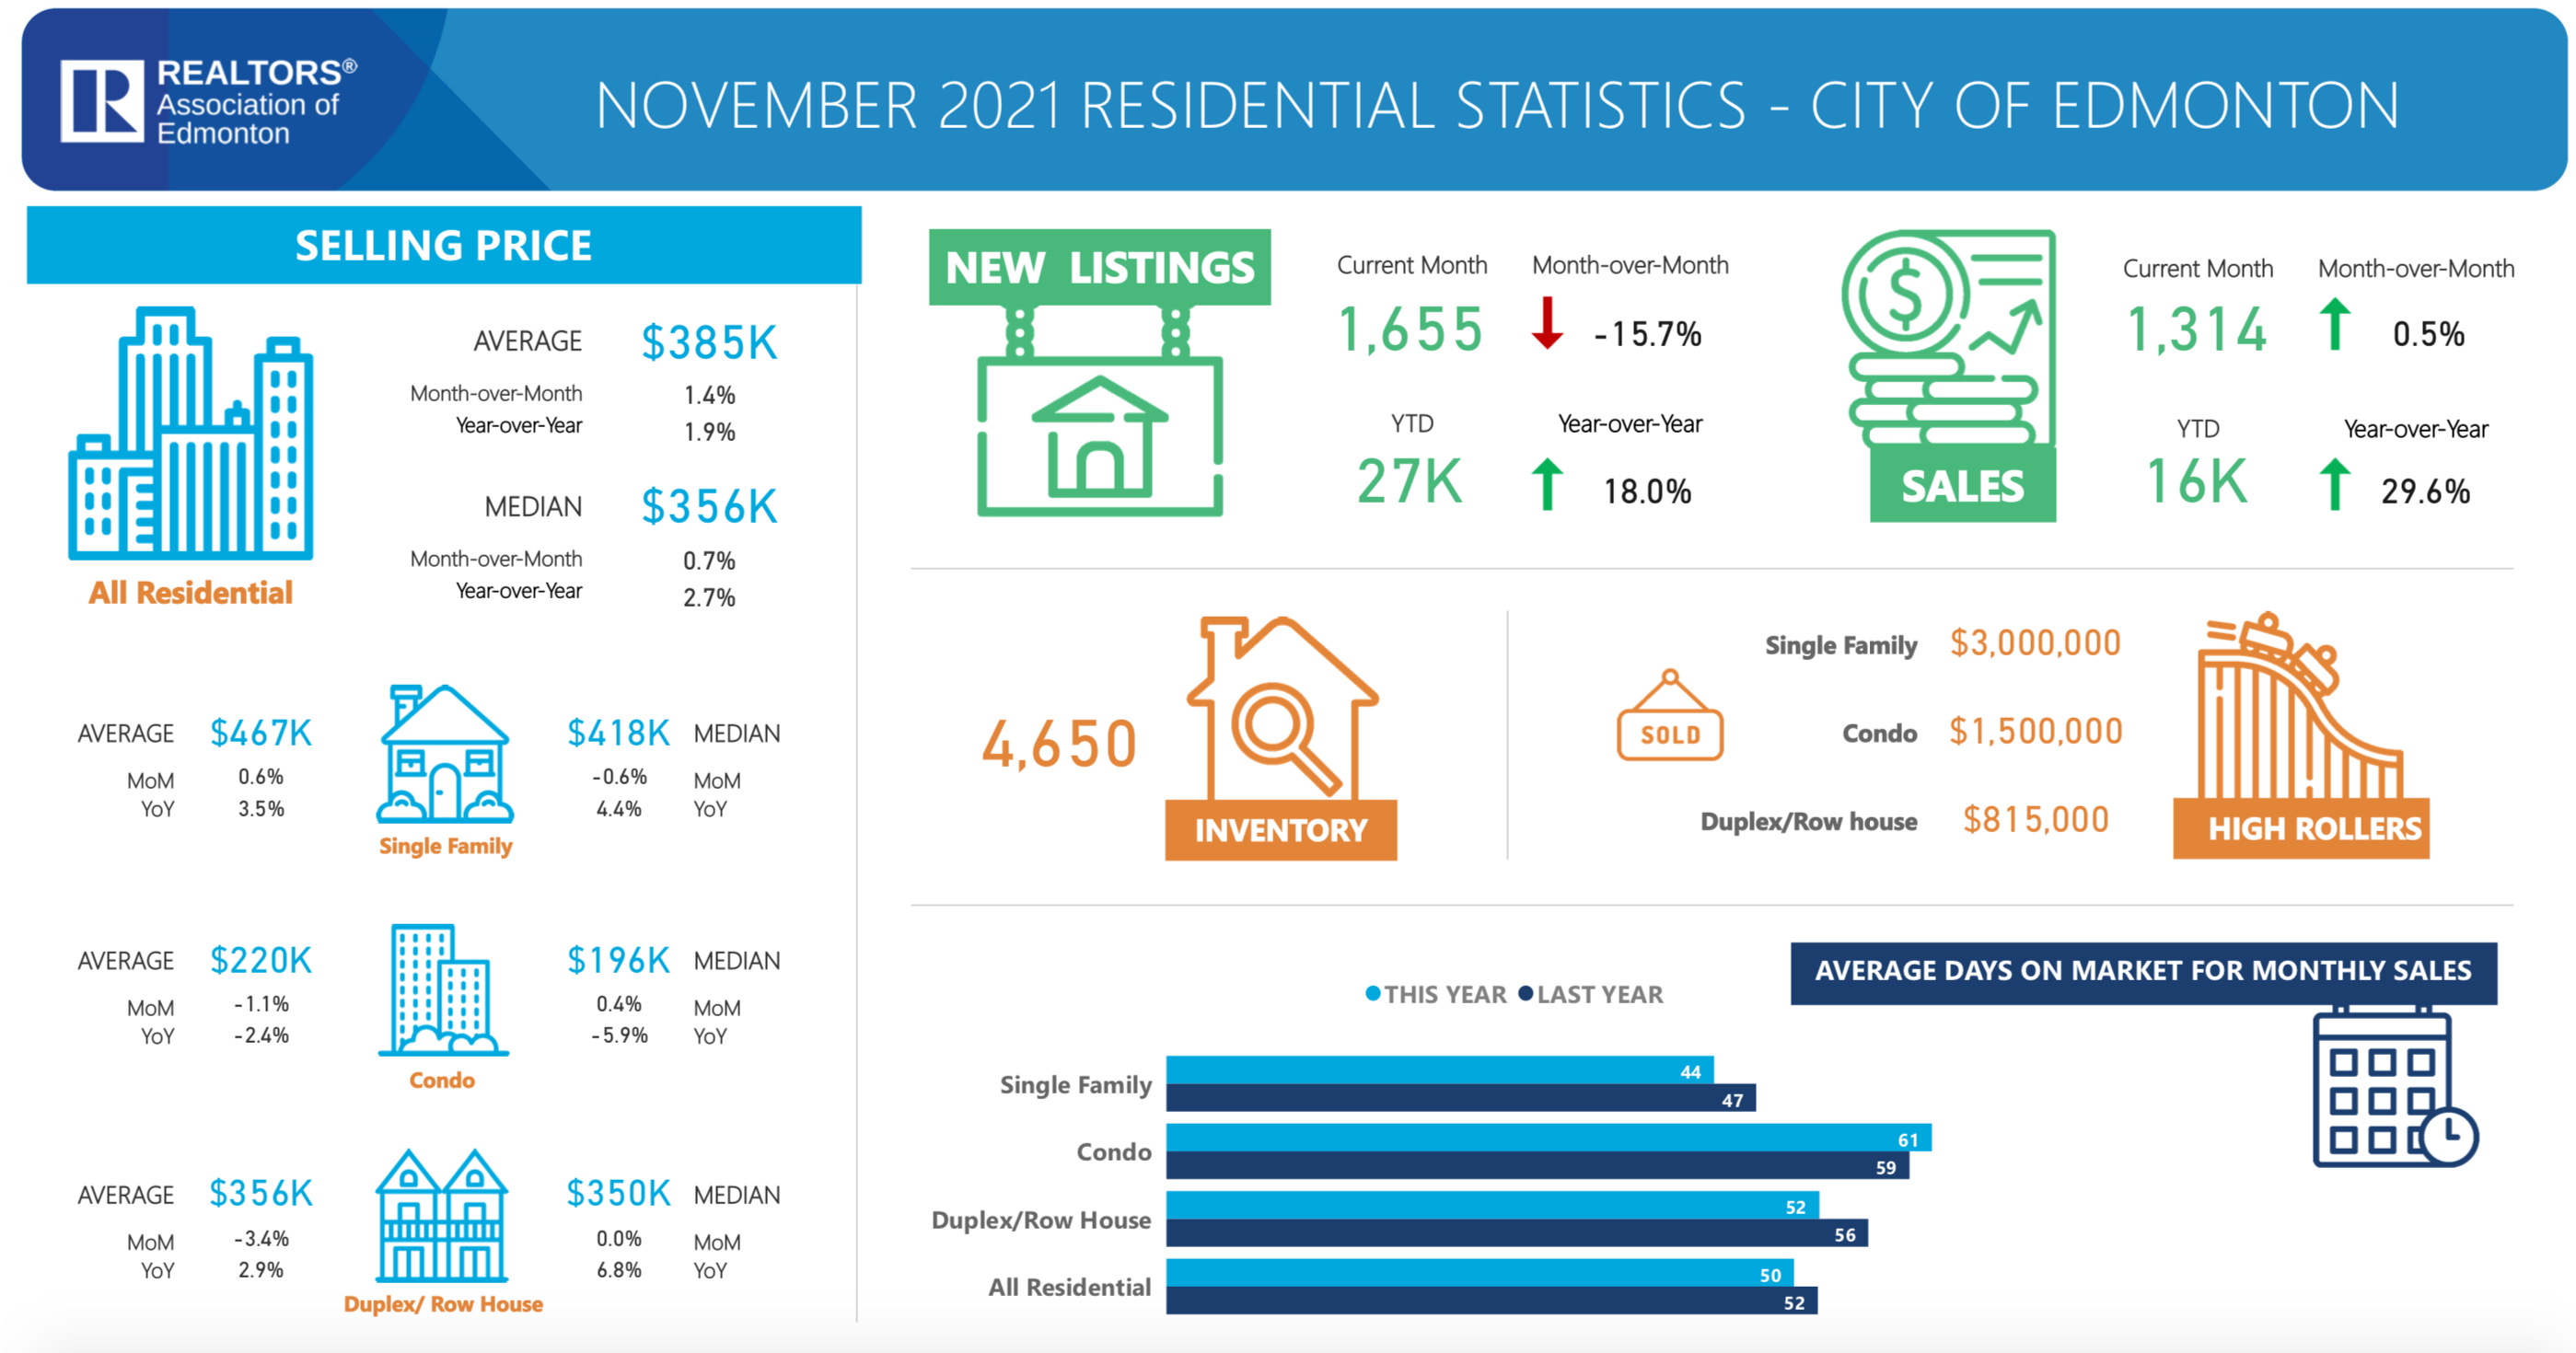
RESIDENTIAL STATISTICS CITY OF EDMONTON November 2021
The REALTORS® Association of Edmonton has released the November 2021 Residential Statistics – City of Edmonton. Home sales in Edmonton were up significantly to same time last year. 1314 residential home sales in November of 2021 up 29.6% (300) homes from November 2020. Average home sale price was $384,619. Prices saw an increase of $7129 from last November that’s an increase of 1.9% year-over-year. Average days on market is sitting at 50 days.
New listings for the month of November came in at 1654 up 251 homes from last year.
The selling price of single family home is at $467,351 up 3.5% from last year. Duplexes and row housing prices are up 2.9% to an average of $356,464. Condo sales saw a decrease in price of -2.4% to an average of $219,684.
MORTGAGE QUALIFICATION CHANGES
Mortgage rate forecast for Q4 2021: Inflation is expecting the mortgage rates to get pushed up. The markets are anticipating the Bank of Canada will raise interest rates six times in 2022, starting in March. Those that are prequalified on their mortgage approval are seeking to get into the market before interest rates go up. New mortgage qualification rules went into effect June 1, 2021. The new minimum qualifying rate for uninsured mortgages will be the contracted rate plus 2 percent or 5.25 percent – whichever is higher. That’s up from the current qualifying rate of 4.79 percent.
According to Ratehub.ca’s calculations, a household with an annual income of $100,000 and a 20 percent down payment – with a 5-year fixed mortgage rate of 1.78 percent amortized over 30 years – would qualify for a home valued at $651,000 under today’s 4.79 percent qualifying rate. Under the new stress test rate of 5.25 percent, the same household’s maximum affordability would decrease to $618,000. That’s a difference of $33,000 (or 5 percent).
READY TO MAKE A MOVE
Looking to make a move in Edmonton’s housing market? CLICK HERE to get a free home evaluation. Start home search by CLICKING HERE.
Not ready to make a move but curious what’s happening in the market in your neighbourhood? CLICK HERE to sign up for neighbourhood news. Get updates on the current listings, sales and real estate trends in your neighbourhood.

RESIDENTIAL STATISTICS CITY OF EDMONTON November 2021
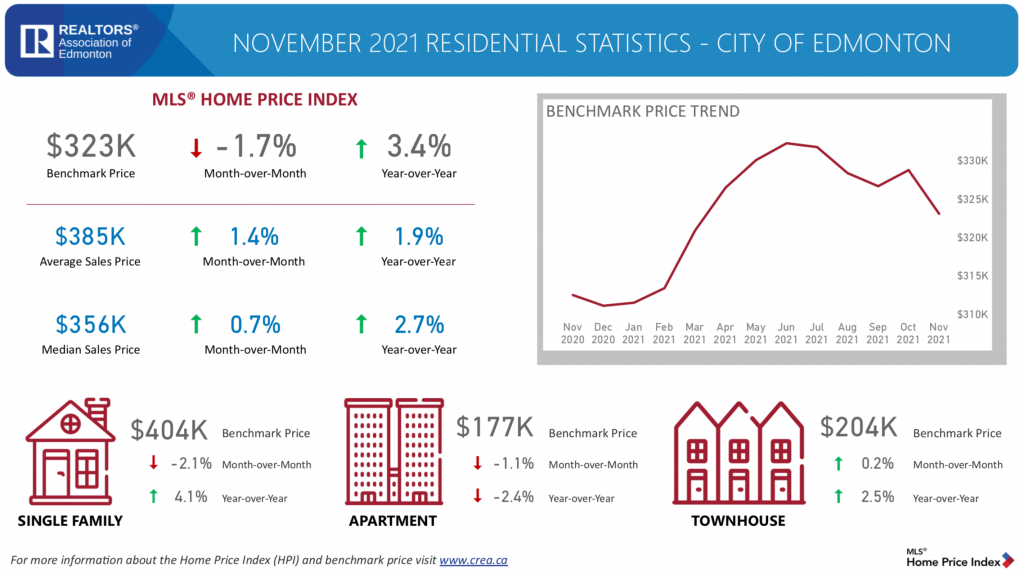
RESIDENTIAL STATISTICS CITY OF EDMONTON November 2021 Home Price Index CREA
For more information on the Canadian Real Estate Associations MLS® Home Price Index CLICK HERE


MLS®: E4295873