Facebook
 X
X
 Pinterest
 Copy Link
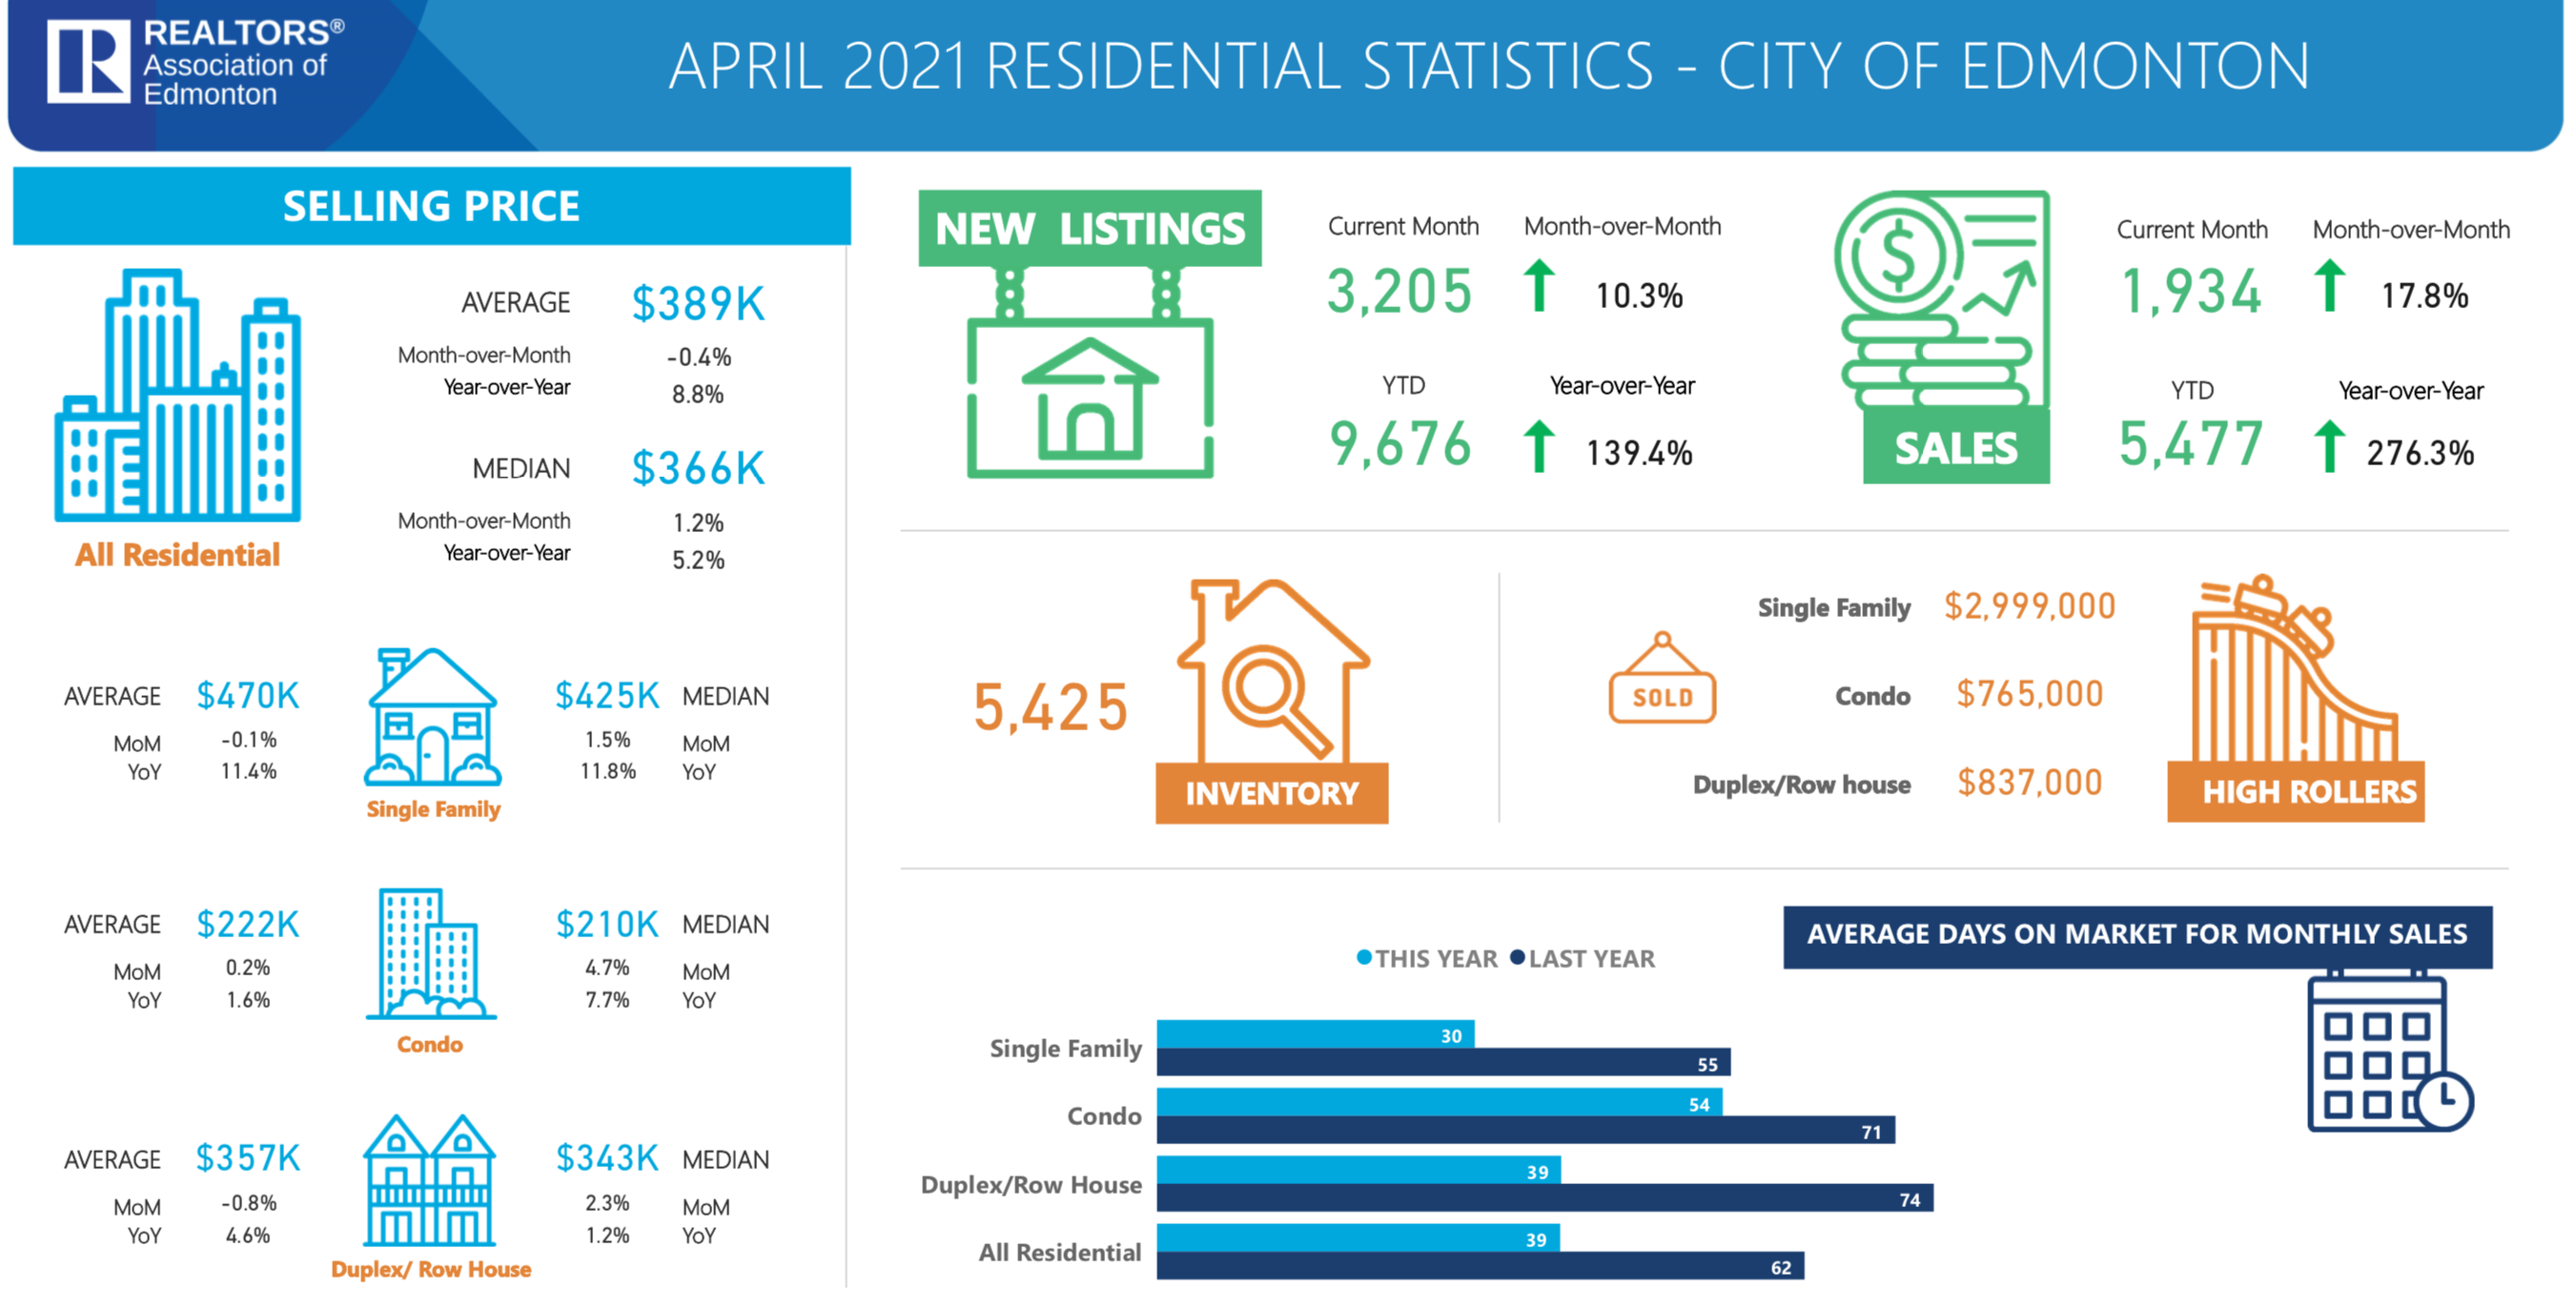
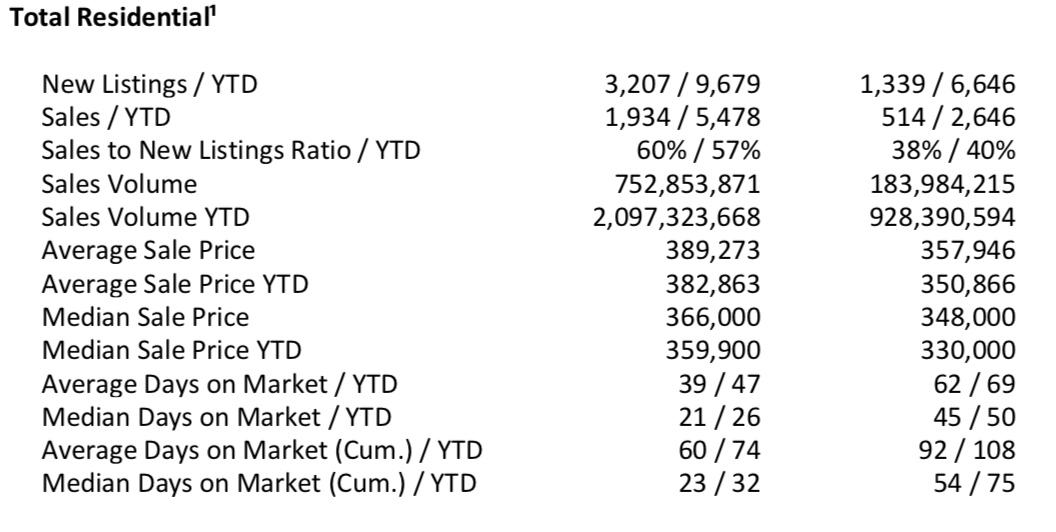
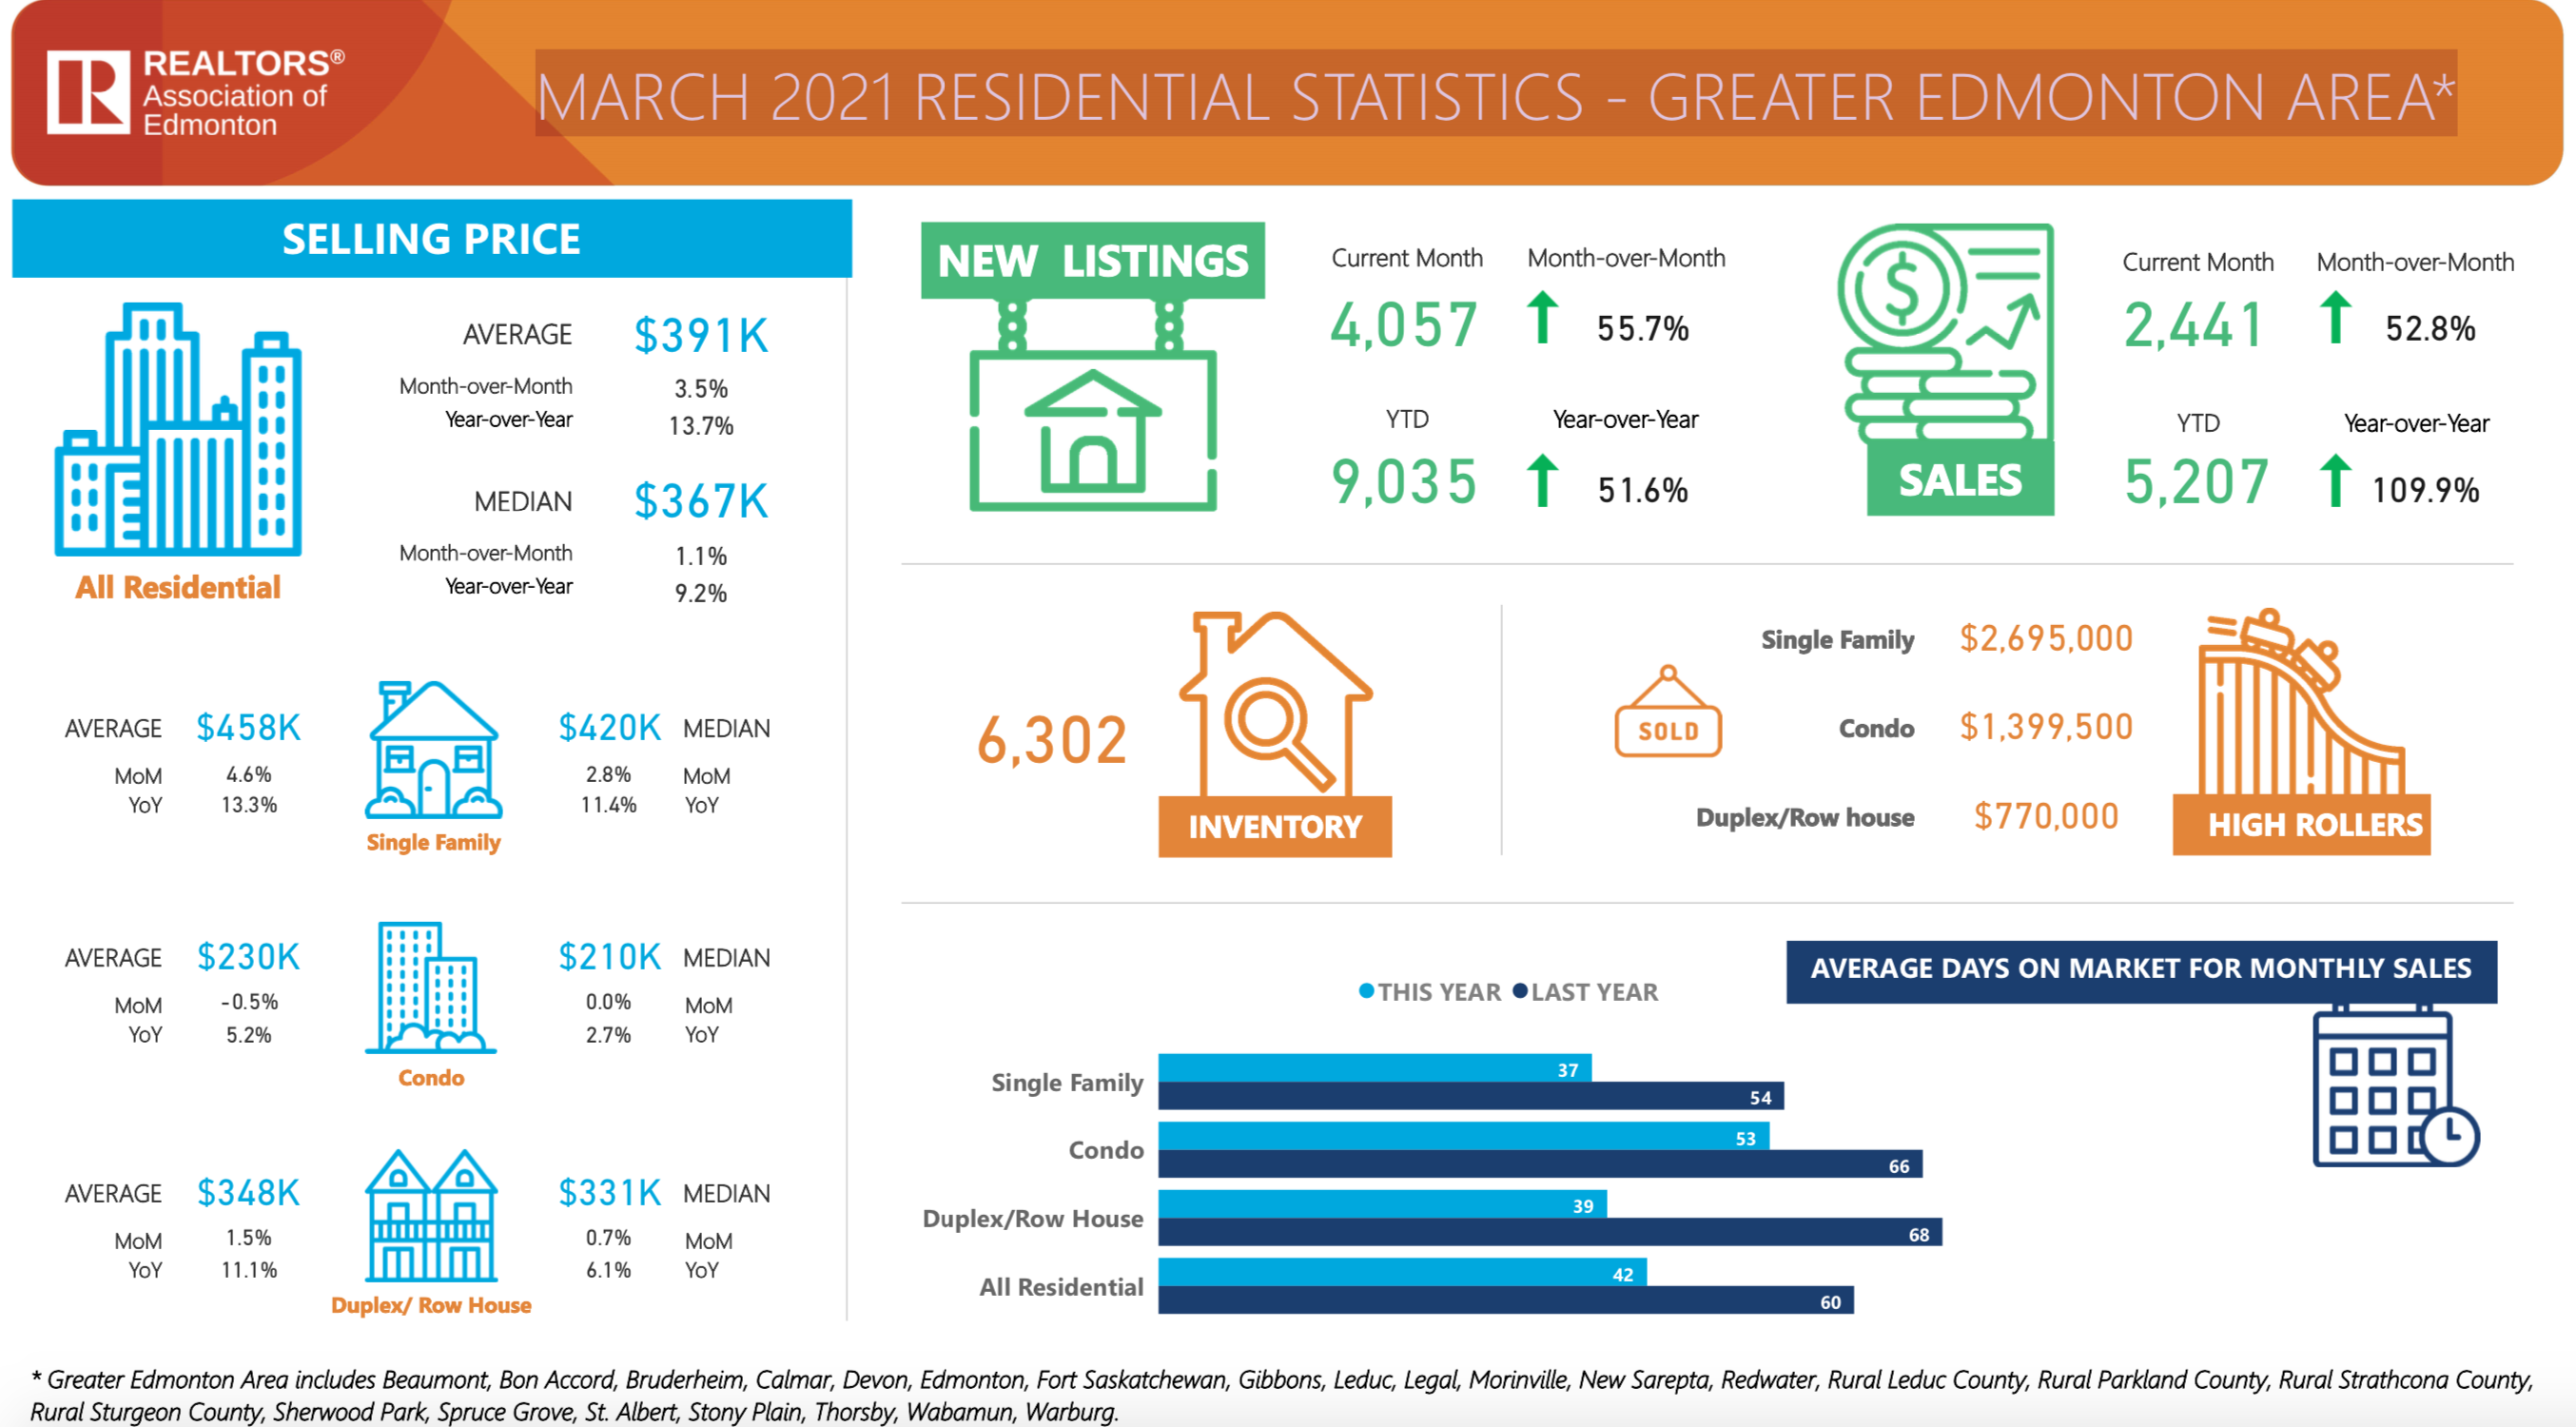
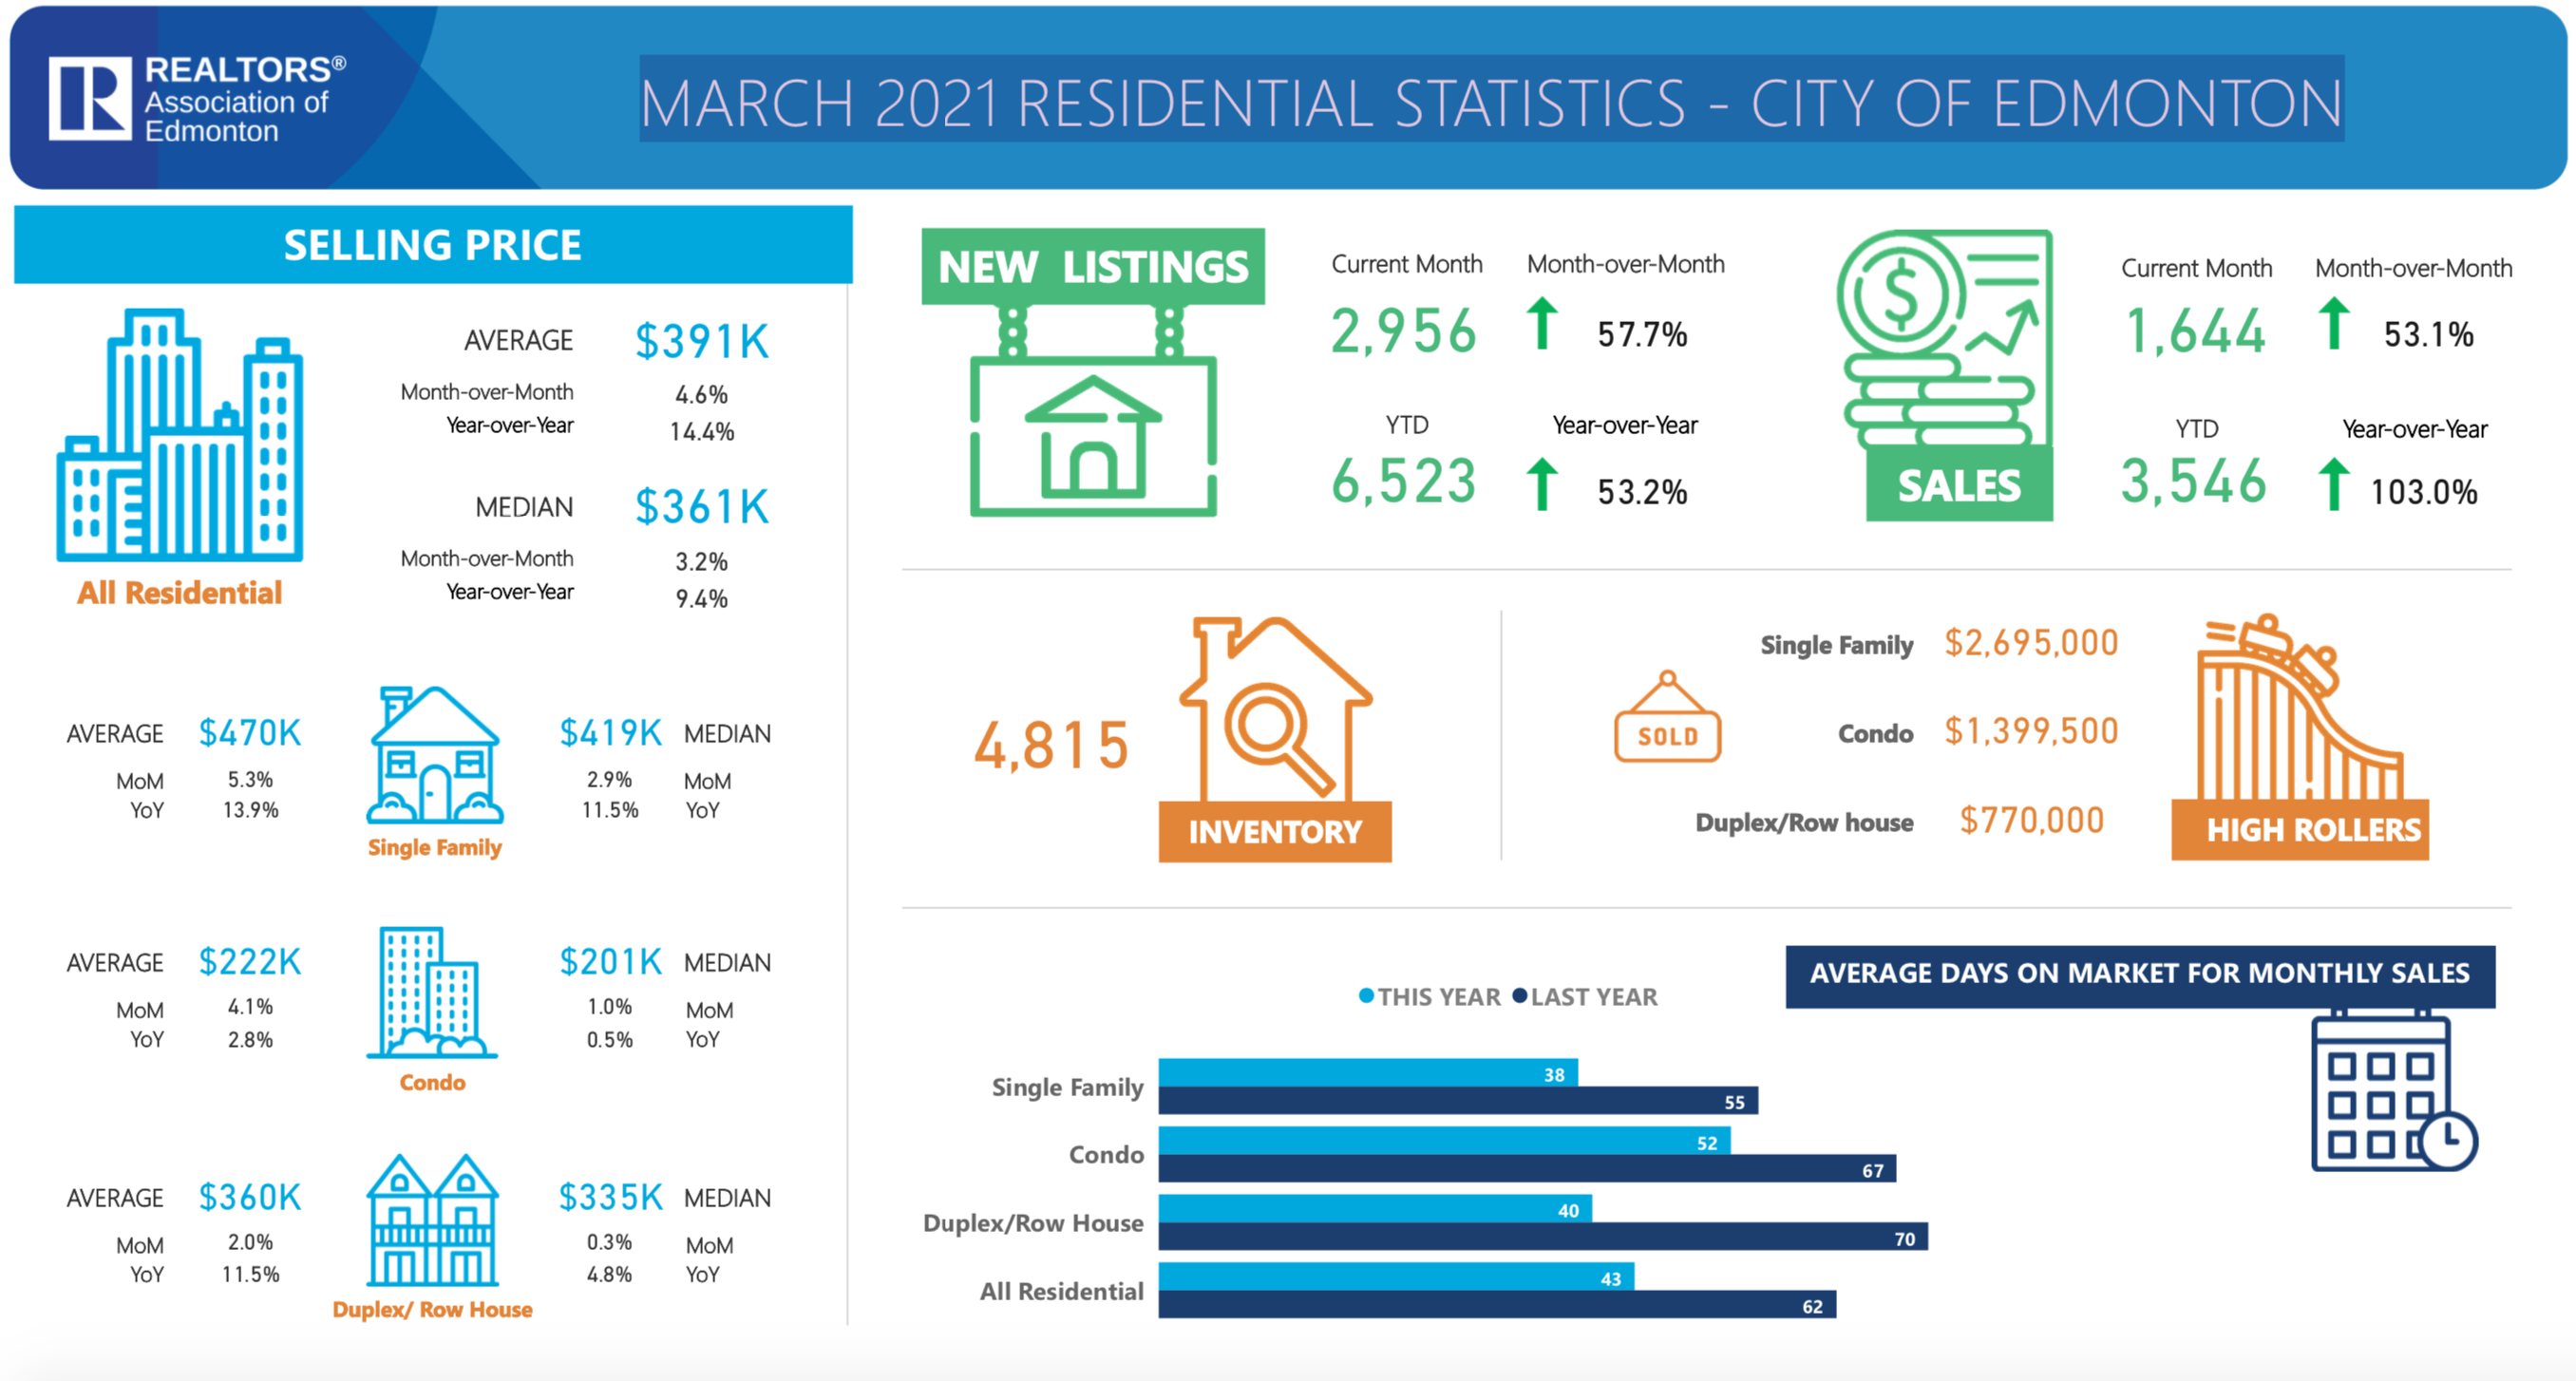
RESIDENTIAL STATISTICS – GREATER EDMONTON AREA APRIL 2021
Residential Statistics – greater Edmonton area* have been released by the REALTORS® Association of Edmonton. April proved another strong month for home sales in the greater Edmonton area. Residential home sales are up 284.5% over April of 2020. Average home sales price up 11.7% from April of 2020 but down .4% from March 2020. Average days on market has dropped from 64 days in 2020 to 37 this year.
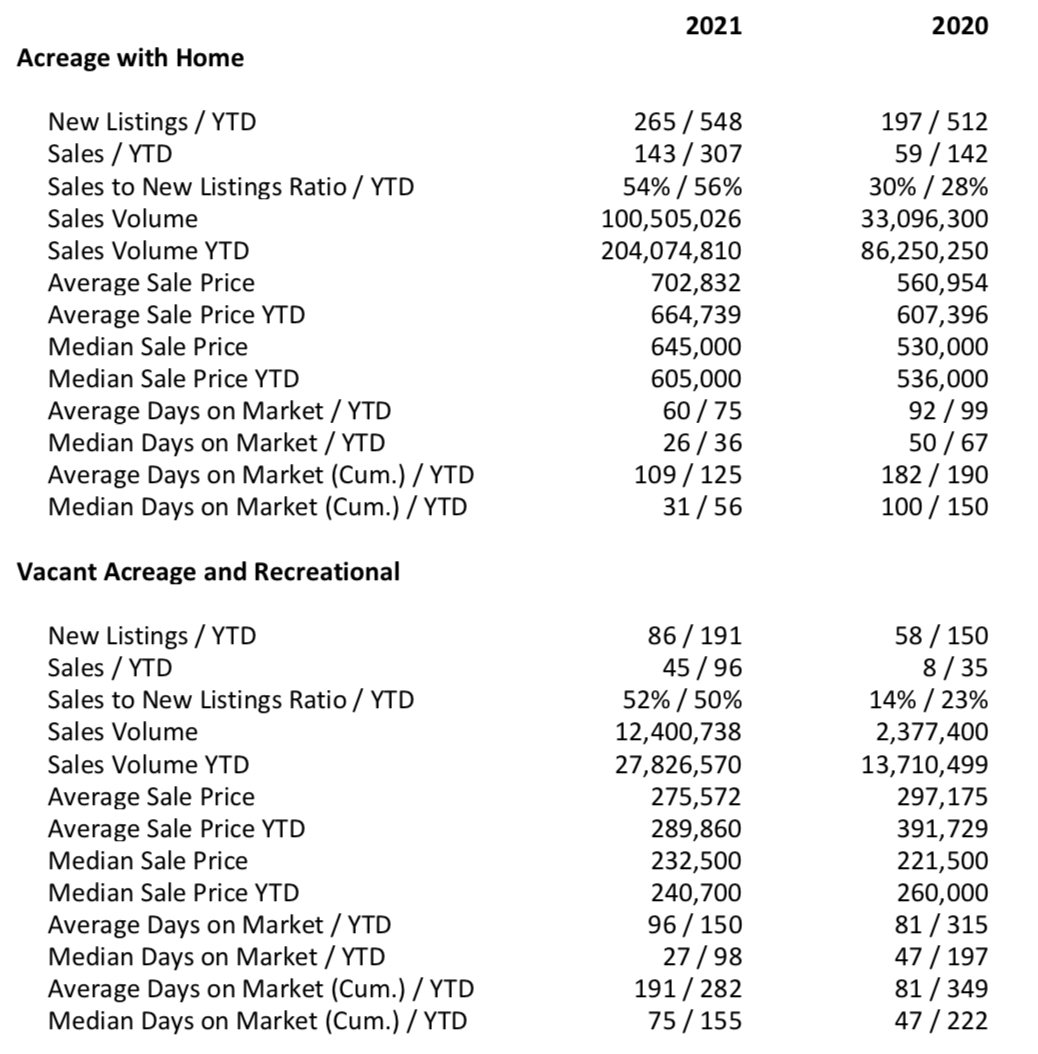
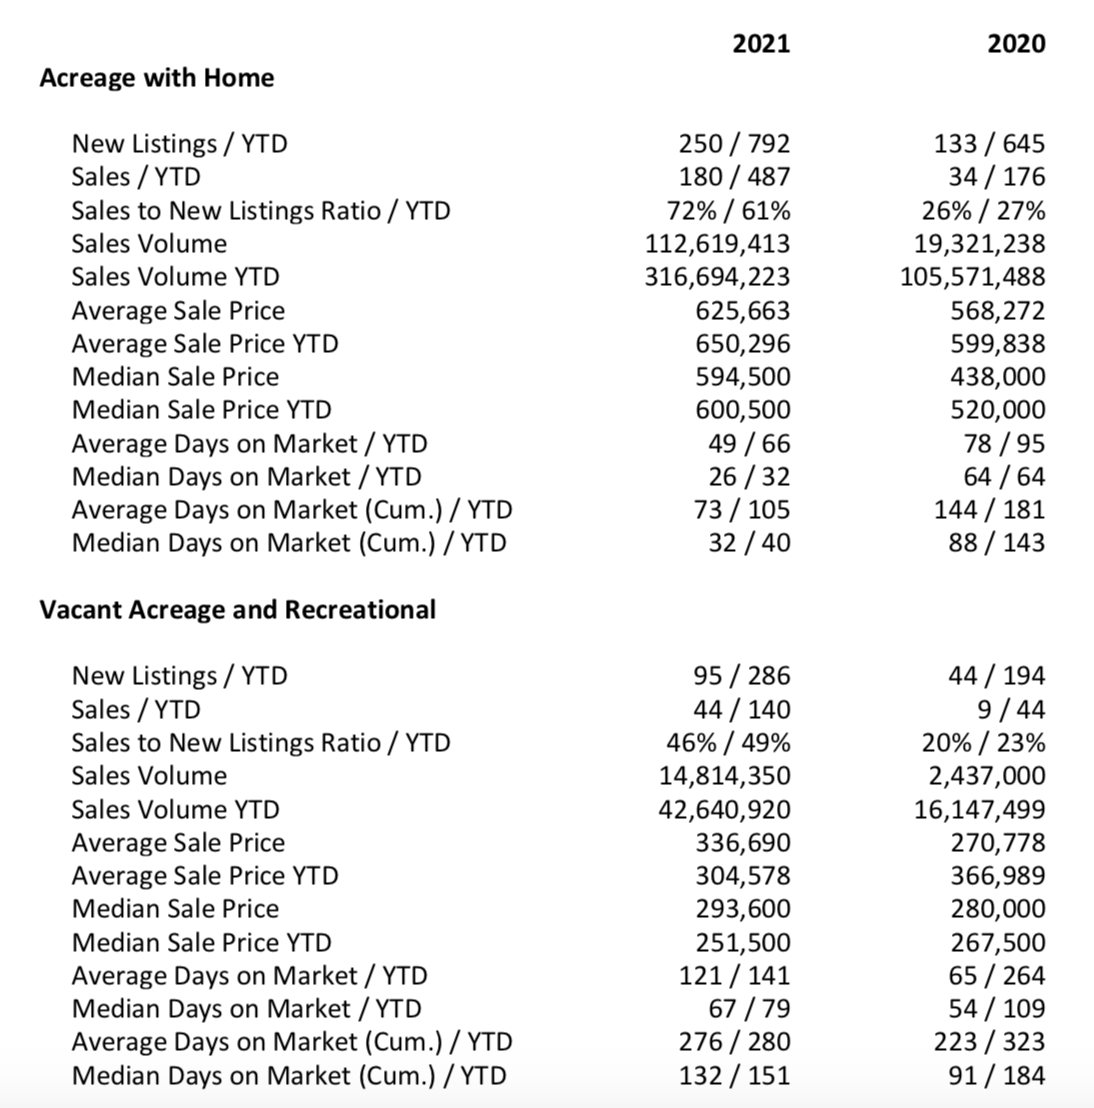
ACREAGE SALES
Acreage home sales are up by 430.2% to 228 sales for the month. The sales volume (money spent) on rural homes up $107,206,525 from last year . The average average selling price of acreages is $565,635.
The rates on home loans are being nudged higher by a rising interest rate, on Canadian five-year government bonds. Several of Canada’s major banks hiked their fixed-rate mortgage rate. As a result, the rates most borrowers pay are now higher by as much as .25% on loans with five-year terms. There are expectations rates will continue to rise, so homebuyers and homeowners may need to move fast to lock in the best rate. If you’re looking to purchase a home, try to lock a low rate now because you’ll be able to hold onto it for up to 120 days.
Looking to make a move in Edmonton’s housing market? CLICK HERE to get a free home evaluation. Start home search by CLICKING HERE.
Not ready to make a move but curious what’s happening in the market in your neighbourhood? CLICK HERE to sign up for neighbourhood news. Get updates on the current listings, sales and real estate trends in your neighbourhood.
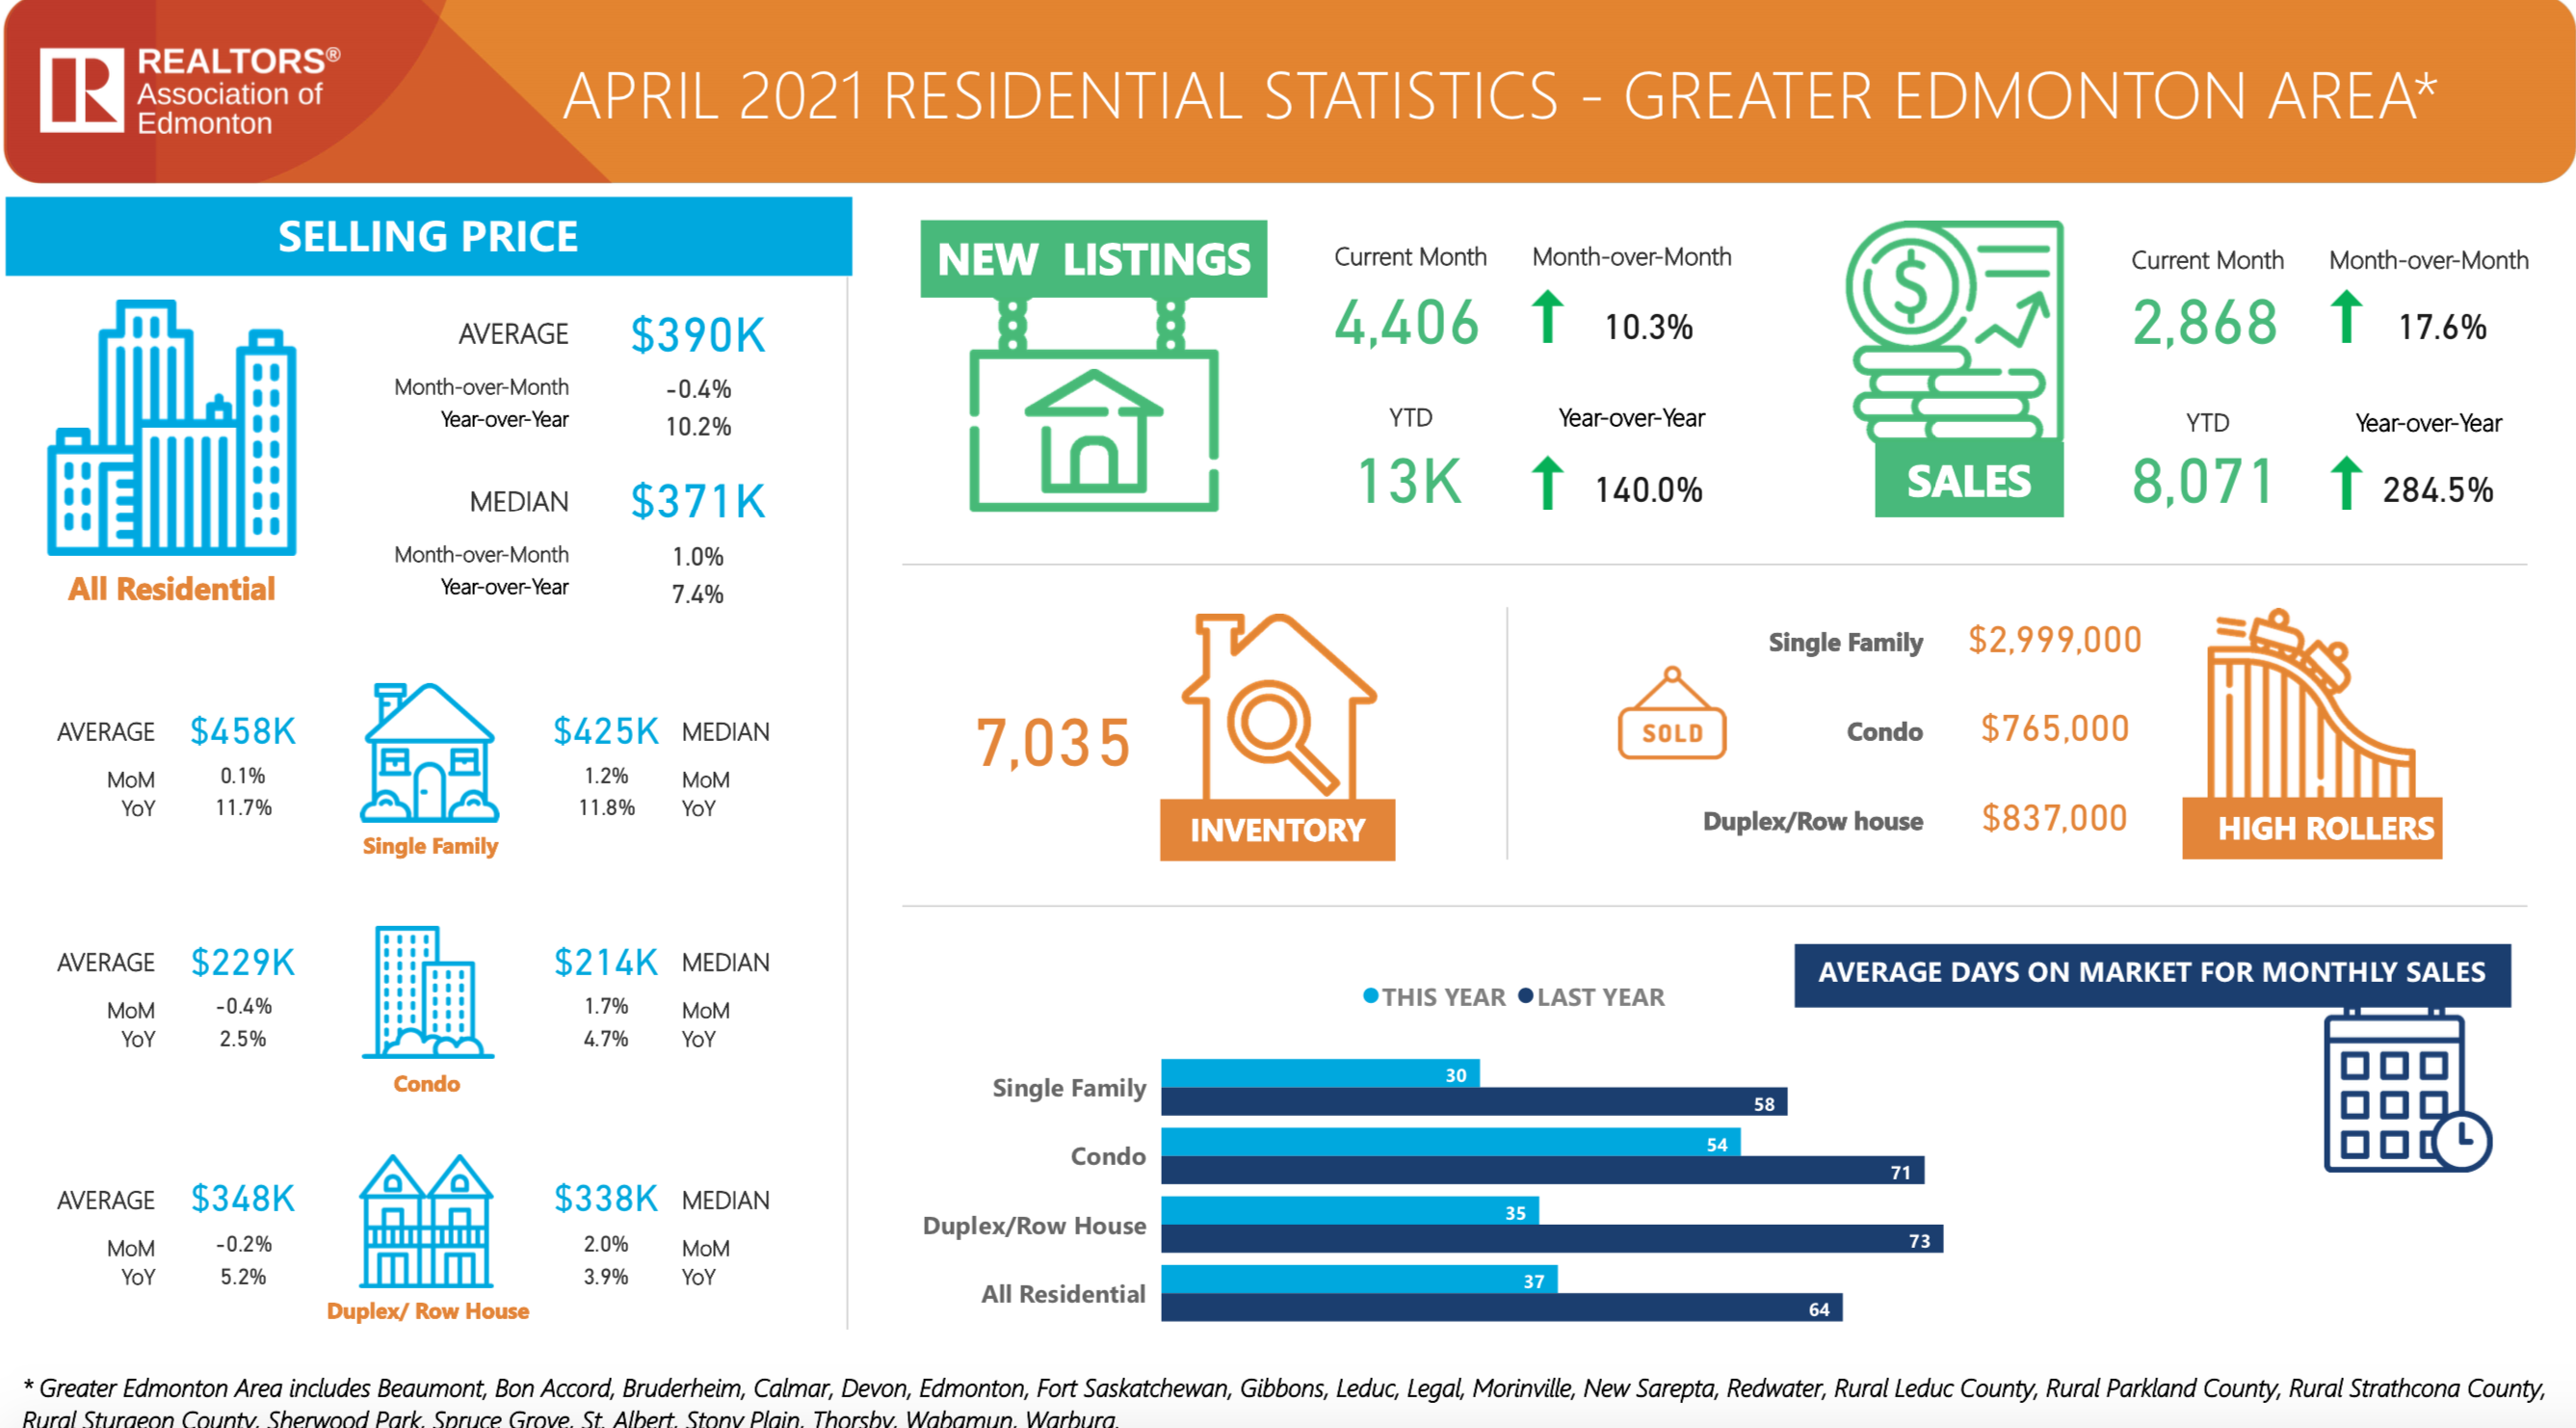
Residential Statistics- Greater Edmonton Area Homes Sales Statistics April 2021 includes Beaumont, Bon Accord, Bruderheim, Calmar, Devon, Edmonton, Fort Saskatchewan, Gibbons, Leduc, Legal, Morinville, New Sarepta, Redwater, Rural Leduc County, Rural Parkland County, Rural Strathcona County, Rural Sturgeon County, Sherwood Park, Spruce Grove, St. Albert, Stony Plain, Thorsby, Wabamun, Warburg.
Rural Statistics of the greater Edmonton area. Home sales statistics April 2021 includes Beaumont, Bon Accord, Bruderheim, Calmar, Devon, Edmonton, Fort Saskatchewan, Gibbons, Leduc, Legal, Morinville, New Sarepta, Redwater, Rural Leduc County, Rural Parkland County, Rural Strathcona County, Rural Sturgeon County, Sherwood Park, Spruce Grove, St. Albert, Stony Plain, Thorsby, Wabamun, Warburg.