
Devon Real Estate Market Update: November 2025
As we approach the final month of the year, the Devon real estate market continues to show remarkable strength — even as many surrounding communities begin their seasonal slowdown. The November 2025 market statistics reveal a surge in sales activity, impressive price growth, and year-to-date numbers that outperform 2024 in almost every category.
If you’re planning to buy or sell this winter or in early 2026, understanding these trends can give you a strategic advantage. Let’s break down the numbers and what they mean for Devon’s housing market.
📊 November 2025 Market Summary
| Metric | November 2025 | % Change vs Nov 2024 |
| Sold Properties | 11 | ↑ 175.00% |
| New Listings | 6 | → 0.00% |
| Average Asking Price | $543,000 | ↑ 18.87% |
| Average Sale Price | $414,000 | ↑ 25.11% |
| Days on Market | 38 days | ↑ 137.50% |
| Ask-to-Sell Ratio | 0.970 | ↓ 3.88% |


Interactive bar graphs
Devon New MLS® Listings
🏘️ Listings Holding Steady
The number of new listings in November remained flat at 6, the same as last year. This means that although demand is rising, supply has not kept pace — which could tighten competition heading into December.
Year-to-date, Devon has recorded 160 new listings, a 17.65% increase from the 136 listings seen by this time in 2024. This is a healthy growth in inventory, giving buyers more choice, but it also means sellers need to be sharp with pricing and presentation to stand out.
Average List Price
💰 Asking Price Reaches Record Levels
November saw a significant spike in the average asking price, which reached $543,000, up 18.87% from last November — the highest monthly average for 2025.
YTD, the average list price sits at $418,000, up 4.57% year-over-year. This upward movement indicates seller confidence and suggests that homeowners are recognizing the long-term value of their properties.
Devon Home Sales
📈 Sales Activity Surges
In a surprising but welcome turn, 11 homes sold in November 2025, which is a 175% increase over November 2024. This strong off-season performance suggests that buyer motivation remains high despite rising interest rates and colder weather.
On a year-to-date basis, 130 homes have sold, compared to 117 last year — a solid 11.11% increase. This growth confirms that Devon continues to attract families, professionals, and investors looking for affordability and lifestyle balance near Edmonton.
Average Sale Price
💵 Sale Price Surges Alongside Demand
The average sale price in November climbed to $414,000, a 25.11% increase over November 2024. This aligns with the jump in buyer activity and suggests that higher-priced homes are selling, or that multiple-offer situations may be driving prices up.
However, year-to-date, the average sale price is $392,000, down slightly from $396,000 in 2024 (a 1.05% decrease). This discrepancy is likely due to earlier months with more modest sales. Still, the recent strength in pricing signals a positive trend heading into year-end.
⚖️ Ask-to-Sell Ratio Dips Slightly
In November 2025, homes sold for 97.0% of their asking price, down from 100.9% last year — a 3.88% decline. This suggests buyers are negotiating more successfully and that sellers may need to be more flexible in price, especially with higher list expectations.
Year-to-date, the ratio is 0.994, just below last year’s 0.996. While small, this change reinforces the importance of strategic pricing — particularly with higher inventory and cautious buyers.
Average Days on Market
⏱️ Days on Market: Longer Time to Sell in November
Homes took 38 days to sell on average in November, up 137.5% from 16 days last year. While this seems like a dramatic jump, it may reflect a few higher-end properties that took longer to sell — or buyers taking more time with decisions in the slower season.
Still, YTD average DOM is just 33 days, an improvement from 37 days in 2024. Overall, homes in Devon are still moving at a healthy pace.
📆 Year-to-Date Comparison – 2025 vs 2024
| Metric | 2025 YTD | 2024 YTD | % Change |
| Sold Properties | 130 | 117 | ↑ 11.11% |
| New Listings | 160 | 136 | ↑ 17.65% |
| Average Asking Price | $418,000 | $400,000 | ↑ 4.57% |
| Average Sale Price | $392,000 | $396,000 | ↓ 1.05% |
| Days on Market | 33 days | 37 days | ↓ 10.81% |
| Ask-to-Sell Ratio | 0.994 | 0.996 | ↓ 0.28% |
🧠 For Sellers: Key Insights
- List Prices Are Strong: This is a favourable time for sellers, with asking prices at an all-time high.
- Sale Prices Are Competitive: Buyers are still willing to pay — especially for updated or move-in-ready homes.
- Don’t Overprice: While list prices are high, sale prices are still trailing slightly. Overpricing could lead to longer days on market.
- Be Ready to Negotiate: With the ask-to-sell ratio dropping slightly, buyers expect some flexibility.
💡 For Buyers: Smart Moves This Winter
- Inventory Is Stable: New listings have increased year-over-year, offering more choice than last fall.
- Pricing Is Rising: Act before prices climb further in spring — November’s average sale price jumped 25.11%.
- You Have Leverage: Slightly longer DOM and a dip in the ask-to-sell ratio suggest room to negotiate.
- Work with a Local Expert: A Devon-focused REALTOR® (like me!) can help you move quickly and confidently.
🌟 Why Devon Continues to Attract
Devon offers an exceptional balance of affordability, quality of life, and community atmosphere. Some of the many reasons why Devon remains a top destination:
- Affordable Housing: Compared to Edmonton, Devon continues to offer better value per square foot.
- Location: Close to major roadways, the airport, and Edmonton’s job market.
- Recreation & Lifestyle: Trails, parks, the river valley, and a growing downtown core.
- Small-Town Feel with Big Amenities: A safe and welcoming place to raise a family or retire in comfort.
🔮 Looking Ahead to December & Early 2026
We anticipate:
- A slight drop in new listings and sales due to seasonal patterns.
- Steady prices as buyers who remain in the market are serious and motivated.
- A strong early spring if mortgage rates stabilize or drop — creating renewed interest and activity.
Sellers who list early in the new year may find themselves in a favourable position if inventory stays tight.
📞 Thinking About Buying or Selling?
Let’s talk strategy. Whether you're relocating, downsizing, upsizing, or investing — I can help you make the most of Devon's evolving real estate market.
Chris Reid
📍 Century 21 Leading
📞 (780) 717‑5267
📧 creid@chrisreidedmonton.com
Data provided by the REALTORS® Association of Edmonton and subject to change. Always consult with a real estate professional for the most current market information.
If you would like more information on the Devon real estate market contact Chris Reid
Town of Devon Website

Leduc Real Estate Market Update: November 2025
The Leduc real estate market continues to evolve in 2025, offering valuable insights for both home buyers and sellers. As one of the fastest-growing cities in the Edmonton Metropolitan Region, Leduc remains a hotbed of activity — with diverse housing options, expanding infrastructure, and increasing interest from both first-time buyers and seasoned investors.
Let’s break down the numbers from November 2025 and explore what they mean for your real estate goals in this thriving Alberta community.
🏡 Key Highlights from the Leduc Market in November 2025
According to the latest data:
- Average List Price: $471,431
- Average Sold Price: $466,350
- Total Sales: 55
- Average Days on Market (DOM): 33
- Sale-to-List Ratio: 98.92%
Interactive bar graphs
Leduc New MLS® Listings
🆕 New Listings: A Seasonal Dip with Strategic Potential
In November 2025, there were 63 new listings brought to market in Leduc, a noticeable dip that aligns with typical seasonal trends. As the weather cools and the holiday season approaches, many sellers choose to hold off until spring, leading to fewer fresh listings in late fall. This reduction in inventory presents a strategic opportunity for sellers — with less competition, your home can stand out more easily. For buyers, fewer new options may mean a tighter search, but it also allows you to focus your attention and negotiate with motivated sellers who are eager to close before year-end.
Average List Price
📈 Average List Price in November 2025
In November 2025, the average list price of a residential property in Leduc climbed to $471,431, marking a noticeable increase from previous months. This upward shift reflects the region's continued desirability and resilience in a changing market. While price growth has been more modest compared to earlier quarters, it shows that sellers are still confident in the value of their homes — particularly in high-demand neighbourhoods like Meadowview Park, Robinson, and Woodbend.
For sellers, this is a signal that your property could attract strong offers — especially if priced competitively and marketed well. For buyers, it emphasizes the importance of acting quickly when you find a home that meets your needs, as prices may continue to inch upward into the new year.
Leduc Home Sales
🏠 Total Sales: Seasonal Slowdown Meets Market Stability
There were 55 homes sold in Leduc in November 2025, reflecting a typical seasonal slowdown as buyers and sellers shift their focus toward the holidays. While this is a drop compared to the spring and summer peak months, it’s not unusual for this time of year.
What’s more important is that demand remains steady despite the colder weather. Leduc continues to attract buyers looking for larger lots, newer homes, and a small-town feel with big-city access — especially in areas like West Haven, Black Stone, and Southfork.
If you're planning to sell in winter, don’t be discouraged. There are still serious buyers in the market, and reduced competition could work in your favour. Likewise, buyers may find opportunities to negotiate better terms when fewer buyers are competing.
Average Sale Price
💵 Average Sold Price: Tracking Buyer Confidence
Leduc’s average sold price in November was $466,350, representing a sale-to-list ratio of 98.92%. This tight ratio underscores a balanced market where sellers are receiving offers very close to asking, but buyers are still able to negotiate a bit of room — especially when properties have been sitting on the market longer than average.
It also reflects continued buyer confidence despite fluctuating interest rates and broader economic concerns. For sellers, it means you’re likely to sell close to your listing price if your home is priced accurately and staged well. For buyers, this data reinforces the importance of being pre-approved and prepared to make a competitive offer when you find “the one.”
Average Days on Market
⏳ Days on Market: Slight Uptick Reflects Holiday Lag
The average days on market for November was 33 days, a small increase from the previous month. This rise is typical for late fall, as the pre-holiday slowdown means buyers are taking more time to make decisions, and fewer new listings are hitting the market.
For sellers, it’s essential to ensure your home is properly staged and priced from day one. Extended time on market can lead to price reductions — something most sellers want to avoid. For buyers, this slightly longer DOM may open the door for better negotiating power, especially on homes that have been listed since early fall.
📊 YTD Comparison: 2024 vs 2025
Here’s how the market has shifted year-over-year:
| Metric | 2024 YTD | 2025 YTD | % Change |
| Average List Price | $442,377 | $466,683 | ↑ 5.5% |
| Average Sale Price | $438,430 | $460,812 | ↑ 5.1% |
| Total Sales | 861 | 802 | ↓ 6.8% |
| Days on Market | 36 | 38 | ↑ 5.6% |
Despite a slight dip in total sales compared to 2024, both average list and sale prices have seen meaningful increases — a strong indicator of market health and property value growth. Slightly longer selling times may point to a more balanced market, giving buyers a bit more breathing room.
🏘️ What Neighbourhoods Are Seeing Activity?
Some of Leduc’s busiest and most in-demand communities continue to drive much of the market activity, including:
- Black Stone
- Meadowview Park
- Southfork
- Woodbend
- Deer Valley
- West Haven
- Robinson
- Tribute
- Creekside
- Parkside
- Edgewater Estates
- Bridgeport
Newer neighbourhoods like Woodbend, Black Stone, and Meadowview are especially popular for families and those looking for newer construction and modern layouts. These areas offer walking trails, parks, and easy access to schools and commuter routes — making them very appealing to buyers in 2025.
🔍 Market Insights for Buyers
If you're a buyer considering entering the Leduc market, the data suggests a favourable window of opportunity. While prices are rising, the seasonal slowdown has created less competition, which can give you room to negotiate and time to shop around.
However, with interest rates and market activity likely to ramp up again in early 2026, acting now could save you money in the long run — both in purchase price and monthly payments. Be sure to get pre-approved, and work with a REALTOR® who knows the Leduc market inside and out (like Chris!).
💼 Market Insights for Sellers
Sellers still hold a strong position heading into the winter months. Even though sales volume dips during the holidays, serious buyers remain in the market — and homes priced and marketed correctly can still sell quickly.
The increase in average sold prices and a sale-to-list ratio above 98% shows that sellers are getting top dollar for their homes. If you're thinking of listing in December or early January, this is the time to get your home ready with a pre-listing strategy, home staging, and professional marketing.
🧠 Chris’s Local Expert Take
Hi, I’m Chris Reid with Century 21 Leading — and I work with buyers and sellers throughout the Leduc area every day. Here’s my take:
“The Leduc market continues to show signs of long-term strength, with modest price gains, consistent sales activity, and continued interest in new family-focused neighbourhoods. We’re seeing great traction in the entry-level detached market and growing interest in quick-possession homes. Whether you’re upsizing, downsizing, or investing — now is a great time to make your move.”
Let’s talk about your goals and build a plan that fits your timeline.
📅 What to Expect for the Remainder of 2025
As we wrap up Q4, expect the market to remain seasonally calm through December, then pick up quickly in Q1 2026. Many buyers and sellers who hit pause for the holidays will jump back into the market in January, so now is the time to prepare for the new year.
Stay tuned for our year-end review next month, where we’ll break down the entire 2025 market and offer predictions for what’s ahead in 2026.
📞 Ready to Buy or Sell in Leduc?
Whether you’re looking to buy your first home, upgrade, downsize, or invest — I’m here to help. With deep local knowledge, a strong network, and a commitment to results, I’m ready to guide you through every step of the Leduc real estate process.
📲 Call or text me anytime at (780) 717‑5267
📍 Chris Reid | Century 21 Leading
🏡 Serving Leduc, Edmonton, Parkland County & beyond
Let’s make your next move your best one yet!
If you would like more information on the Leduc real estate market contact Chris Reid
Edmonton Condo Real Estate Market November 2025
The Edmonton condo real estate market continues to showcase resilience, adaptability, and opportunity—despite cooler seasonal trends. November data reveals slight declines in both activity and pricing compared to the previous month, but strong year-over-year performance signals that the Edmonton condo market remains a valuable entry point for both investors and first-time buyers alike.
Whether you're looking to sell your condo, purchase your first home, or invest in affordable property in Edmonton, these statistics will help you understand where the market stands and how to make informed decisions.
📈 Edmonton Condo Market Summary – November 2025
| Metric | November 2025 |
| Total Condo Sales | 218 units |
| New Listings | 460 units |
| Average Asking Price | $244,000 |
| Average Sale Price | $224,000 |
| Average Days on Market | 68 days |
| Ask-to-Sell Ratio | 91.8% |


Bar Graphs Below Are Interactive
Edmonton Condo New MLS® Listings
🆕 New Listings: Inventory Shrinks Slightly, Keeping Competition Balanced
November saw 460 new condo listings, down from 545 in October. This drop in inventory is welcome news for current condo owners looking to sell. With fewer listings on the market, the remaining inventory has a better chance of catching buyer attention.
Less inventory also means that well-presented condos with modern finishes or favourable locations (Downtown, Oliver, Strathcona) can still generate interest and even receive multiple offers, especially in lower price ranges.
Average List Price Edmonton Condos
💰 Average Asking Price: Sellers Remain Optimistic
The average asking price for an Edmonton condo in November 2025 stood at $244,000, only slightly down from $246,000 in October. This minimal decline indicates that sellers remain confident in the market's long-term strength and are pricing their properties accordingly.
📌 Why It Matters:
- The market hasn’t seen any panic pricing or dramatic drops.
- Sellers still anticipate strong value retention.
- Buyers should be prepared to negotiate, but don't expect deep discounts unless a unit is overpriced or stale.
Edmonton Condo Sales
🏢 Condo Sales: Lower Month-Over-Month, But Still Stable
Condo sales in Edmonton dropped to 218 units in November, a slight decrease from October’s 261 sales. However, this seasonal softening is typical as winter approaches. While activity slows, serious buyers remain in the market, making this an excellent time for well-priced listings to shine with less competition.
If you're a seller, pricing your condo correctly and marketing strategically can still yield strong results—even during the colder months.
Edmonton Average Condo Sale Price
📉 Average Sale Price: Slight Dip But Strong Yearly Growth
The average sale price for a condo was $224,000 in November—down from October’s $228,000. Although we’re seeing a month-over-month decrease, the year-over-year trajectory is positive, with condo values up considerably compared to the same time in 2024.
This suggests that while we’re entering a seasonally slower market, condos continue to appreciate steadily over time—great news for investors and long-term buyers.
🔄 Ask-to-Sell Ratio: 91.8% Means Price Realism Is Key
November’s ask-to-sell ratio landed at 91.8%, down slightly from 92.7% in October. This metric reflects how close sellers are coming to their list prices. A ratio below 95% signals that negotiation remains part of the process—and it’s critical that listings are priced realistically from the outset to avoid long delays or significant price reductions.
Sellers should take note: pricing too high can lead to longer time on market and weaker offers.
Average Days on Market
⏱️ Days on Market: Still Under 70, Encouragingly Fast for Condos
The average days on market (DOM) was 68 days, holding steady compared to October. While this number might seem high compared to single-family homes, it is typical for the condo segment, where buyers often take more time to assess building condition, condo fees, amenities, and financials.
What’s important is that this number hasn’t spiked—suggesting that demand remains consistent, and properly marketed condos are still selling within 2–3 months.
📊 Year-to-Date Comparison – Condo Market 2025 vs 2024
Here’s a breakdown of how 2025 is shaping up compared to the same time last year:
| Metric | 2025 YTD | 2024 YTD | % Change |
|---|---|---|---|
| Sold Properties | 2,923 | 3,000 | -2.57% |
| Average Asking Price | $238,000 | $234,000 | 1.71% |
| New Listings | 5,508 | 5,135 | 7.27% |
| Average Sale Price | $211,000 | $197,000 | 7.11% |
| Days on Market | 67 | 71 | -5.63% |
| Ask-to-Sell Ratio | 0.966 | 0.969 | -0.31% |
📌 Key takeaways from this table:
- Condo prices are rising steadily year-over-year.
- More listings are coming online, suggesting higher seller confidence.
- Despite a slight dip in total sales, demand remains strong.
- The DOM is improving, meaning condos are selling faster than last year.
🔮 What to Expect Heading Into Winter
December and January typically bring the slowest periods in Edmonton’s condo market. However, this can create opportunity for motivated buyers, as many listings stay on the market longer and sellers are more willing to negotiate.
For sellers, this is a time to stand out with proper pricing, updated photos, and strong marketing. Consider refreshing your listing if it’s been active for more than 30 days with no offers.
For buyers, there’s less competition, so you can move strategically and perhaps secure favourable pricing or terms.
👨💼 Advice for Buyers
- 💡 Explore neighbourhoods like Downtown, Oliver, and Queen Mary Park for value and convenience.
- 📊 Use the DOM and ask-to-sell ratio data to make competitive offers without overpaying.
- 🏢 Ask your agent to review condo documents for reserve fund health, special assessments, and by-laws.
- 🏦 Lock in interest rates while they're still relatively low to secure affordability.
🏡 Advice for Sellers
- 📸 Update listing photos to include interior lighting and cozy winter staging.
- 🎯 Price strategically based on recent sales (not wishful thinking).
- 📍 Highlight proximity to LRT stations, river valley, shopping, and post-secondary schools.
- ⌛ If you're planning to sell in spring 2026, consider pre-listing in January/February to get ahead of the wave.
🏁 Final Thoughts: Condo Buyers and Sellers Still Have Leverage
While November marks a seasonal slowdown, the numbers show a condo market that is far from dormant. In fact, the Edmonton condo segment continues to outperform expectations in key metrics like price growth, DOM, and listing volume.
Whether you’re thinking of buying or selling a condo in Edmonton, the right strategy makes all the difference. As your local condo market expert, I’m here to help guide you through the process.
📞 Ready to Move Forward?
Have questions about your condo’s value or want to browse available listings?
📱 Call or text Chris Reid today at (780) 717-5267
📍 Century 21 Leading – Your Edmonton Condo Expert
🖥️ Let’s talk about your goals, timelines, and how to position you for success in this market.
Data provided by the REALTORS® Association of Edmonton and subject to change. Always consult with a real estate professional for the most current market information.
Are you considering buying or selling or just interested in more information on the condo real estate market in Edmonton? CONTACT ME HERE
City of Edmonton Website
Fort Saskatchewan Real Estate Market November 2025
The Fort Saskatchewan real estate market in November 2025 reflects a period of adjustment rather than decline. While some headline numbers show notable month-over-month changes, the broader year-to-date data confirms that Fort Saskatchewan continues to operate within a balanced and resilient market framework.
November typically marks one of the slowest months of the year for real estate activity, and this year was no exception. Seasonal factors, weather conditions, and year-end planning all play a role in shaping buyer and seller behaviour. However, when viewed in context — particularly against November 2024 — the market tells a story of measured correction, stable demand, and strong long-term fundamentals.
For buyers, this creates opportunity through softer pricing and reduced competition. For sellers, success hinges on strategic pricing, presentation, and realistic expectations. Let’s break down exactly what the November 2025 numbers reveal and what they mean for Fort Saskatchewan moving into the end of the year.
Fort Saskatchewan Market Snapshot – November 2025
| Metric | November 2025 | % Change vs November 2024 | 2025 YTD | 2024 YTD | % Change YTD |
| Sold Properties | 43 | +16.22% | 673 | 738 | -8.81% |
| New Listings | 41 | -40.58% | 872 | 903 | -3.43% |
| Average Asking Price | $442,000 | -9.99% | $459,000 | $476,000 | -3.46% |
| Average Sale Price | $426,000 | +1.10% | $461,000 | $442,000 | +4.27% |
| Days on Market | 56 | +51.35% | 46 | 57 | -19.30% |
| Ask-to-Sell Ratio | 0.988 | -0.30% | 0.998 | 0.992 | +0.55% |
Bar Graphs Below Are Interactive
Fort Saskatchewan New MLS® Listings
New Listings: Sharp Monthly Decline Tightens Inventory
One of the most striking changes in November was the sharp decline in new listings. Only 41 new properties came to market, a 40.58% decrease compared to November 2024. This significant drop is largely driven by seasonal behaviour, as many homeowners choose to delay listing until the new year.
Year-to-date, Fort Saskatchewan has seen 872 new listings, down 3.43% from 903 listings in 2024. While inventory has eased slightly, it remains sufficient to support balanced market conditions rather than tipping into a seller-dominated environment.
For buyers, fewer new listings mean less choice in the short term, particularly in popular price ranges. For sellers, reduced competition can work in their favour — especially if their property is well-priced and professionally marketed.
Fort Saskatchewan Average List Price
Average Asking Price: Sellers Reset Expectations
The average asking price in November 2025 was $442,000, marking a 9.99% decline compared to November 2024. On a year-to-date basis, the average asking price sits at $459,000, down 3.46% from last year.
This adjustment reflects a clear recalibration of seller expectations. As affordability pressures and interest-rate sensitivity shaped buyer behaviour throughout 2025, sellers increasingly responded by pricing more competitively. This shift has played a crucial role in keeping transactions moving, even during slower seasonal months.
Importantly, lower asking prices do not necessarily mean reduced value. Instead, they signal a market where accurate pricing is essential — and where overpriced listings are far more likely to stagnate.
Fort Saskatchewan Home Sales
Sold Properties: Seasonal Uptick Despite a Softer Annual Total
In November 2025, Fort Saskatchewan recorded 43 sold properties, representing a 16.22% increase compared to November 2024. This year-over-year monthly gain is a positive signal, especially given that November is historically a slower month for sales activity.
However, when viewed on a year-to-date basis, total sales reached 673 transactions, which is 8.81% lower than the 738 sales recorded by this point in 2024. This decrease reflects the broader market normalization seen throughout 2025 following several years of elevated demand and rapidly rising prices.
Rather than indicating weakness, this shift suggests a market that has transitioned from overheated conditions into a more sustainable pace. Buyers are still active, but they are more selective and price-conscious. Sellers who adapt to these conditions continue to achieve successful outcomes.
Fort Saskatchewan Average Home Sale Price
Average Sale Price: Long-Term Value Remains Intact
Despite the decline in asking prices, the average sale price in November 2025 increased to $426,000, representing a 1.10% increase compared to November 2024. This contrast highlights an important trend: homes that are priced appropriately are still selling well.
On a year-to-date basis, the average sale price across Fort Saskatchewan reached $461,000, up 4.27% from $442,000 in 2024. This continued appreciation underscores the city’s strong long-term fundamentals and ongoing appeal to buyers seeking affordability without sacrificing quality of life.
The data suggests that while sellers are listing more conservatively, buyers remain willing to pay fair market value — particularly for well-maintained homes in desirable neighbourhoods.
Ask-to-Sell Ratio: Strong Pricing Integrity Holds
The average ask-to-sell ratio in November 2025 was 0.988, indicating that homes sold for 98.8% of their asking price. While this is a slight 0.30% decrease compared to November 2024, it still reflects a very healthy level of pricing integrity.
Year-to-date, the ratio stands at 0.998, up 0.55% from 2024. This means that across the year, sellers have consistently achieved near-full asking price — a hallmark of a balanced and confident market.
Negotiation is present, but it remains reasonable and data-driven rather than aggressive or one-sided.
Average Days on Market
Days on Market: Seasonal Slowdown, Faster Annual Performance
Homes took longer to sell in November, with the average days on market increasing to 56 days, a 51.35% increase compared to November 2024. This is typical for late fall, when buyer activity naturally slows due to weather, holidays, and year-end planning.
However, the year-to-date picture tells a much more encouraging story. Properties in Fort Saskatchewan have averaged 46 days on market in 2025, down 19.30% from 57 days in 2024. This means that overall, homes are selling significantly faster than last year.
For sellers, this reinforces the importance of timing and presentation. Listings that come to market during slower months must stand out through competitive pricing and strong marketing strategies.
Year-to-Date Market Summary: A Stable Year in Review
As of the end of November 2025, Fort Saskatchewan’s real estate market shows:
- Sales volume slightly lower, reflecting normalization rather than decline
- Inventory levels steady, with seasonal tightening late in the year
- Sale prices up over 4% year-over-year, confirming long-term growth
- Faster overall selling times, despite seasonal slowdowns
- Strong ask-to-sell ratios, preserving seller value
These indicators collectively point to a market that has transitioned into a sustainable, balanced phase — one that benefits informed buyers and strategic sellers alike.
Buyer Guidance: Late-Year Opportunities Emerge
For buyers, November presents a unique opportunity. With fewer listings and reduced competition, those who remain active often enjoy greater negotiating power and more focused seller attention.
Key advantages for buyers include:
- More motivated sellers
- Stabilized pricing after earlier market adjustments
- Improved affordability compared to early 2024
- Less competition due to seasonal slowdown
Buyers who are prepared and decisive can secure excellent value — particularly in the detached and townhome segments that remain popular in Fort Saskatchewan.
Seller Guidance: Strategy Matters More Than Timing
While some sellers prefer to wait until spring, November 2025 demonstrates that success is still achievable for those who list strategically.
Seller tips for late-year success:
- Price realistically based on recent comparable sales
- Ensure strong online presentation, including professional photos
- Be flexible with showings and negotiations
- Work with a REALTOR® who understands local market nuance
With limited new listings entering the market, well-positioned homes can still attract serious buyers even in quieter months.
Market Forecast: A Balanced Close to 2025
Looking ahead to December and early 2026, Fort Saskatchewan is expected to maintain its balanced conditions. Inventory is likely to remain constrained through winter, while buyer demand continues at a measured pace.
If interest rates ease in the coming year, buyer confidence could strengthen further, supporting steady price performance without sharp volatility.
Overall, the market outlook remains stable, predictable, and favourable for long-term planning.
Final Thoughts: Fort Saskatchewan Continues to Deliver Stability
The November 2025 Fort Saskatchewan real estate market reinforces the city’s reputation as one of the most reliable and affordable housing markets in the Edmonton region. While seasonal slowdowns are evident, long-term trends point to sustained value and balanced conditions.
Whether you’re buying, selling, or simply planning ahead, understanding these market dynamics is essential to making confident decisions.
Thinking about buying or selling in Fort Saskatchewan? Get expert local guidance and a data-driven strategy tailored to your goals.
📞 Call Chris Reid at (780) 717-5267 to discuss your next move with confidence.
Data provided by the REALTORS® Association of Edmonton and subject to change. Always consult with a real estate professional for the most current market information.
Are you considering buying or selling or just interested in more information on the real estate market in Fort Saskatchewan? CONTACT ME HERE
City of Fort Saskatchewan Website


St. Albert Real Estate Market Update: November 2025
As we move toward the end of the year, the St. Albert real estate market is settling into a more seasonal rhythm while continuing to demonstrate long-term stability and resilience. November 2025 reflects a typical late-fall market: fewer sales, longer days on market, and some short-term price softening—balanced by strong year-to-date price growth, increased inventory, and sustained buyer confidence.
For buyers, November presents opportunities to negotiate and secure value before year-end. For sellers, the data confirms that while the pace has slowed, St. Albert remains one of the most dependable and equity-driven markets in the Edmonton region.
If you’re thinking about buying or selling, now is an ideal time to understand where the market stands—and where it’s heading next. For personalized advice, contact Christina Reid, REALTOR® with Century 21 Leading, at (780) 717-5267.
📊 St. Albert Real Estate Statistics – November 2025
Let’s begin with a snapshot of the key market metrics for November.
November 2025 Market Highlights
- 81 homes sold, down 14.74% from November 2024
- Average sale price: $465,000, down 10.41% year-over-year
- Average asking price: $580,000, down 0.15%
- 113 new listings, up 37.80%
- 62 days on market, down 1.59%
- Ask-to-sell ratio: 0.987


Bar Graphs Below Are Interactive
St. Albert New Listing Count
📦 New Listings Surge: More Choice for Buyers
One of the most notable November trends is the increase in new listings.
- 113 new listings in November
- +37.80% increase year-over-year
- YTD listings up 7.89%
This influx of inventory provides buyers with more choice and negotiating power, particularly in detached homes and townhomes.
For sellers, it reinforces the importance of:
- Strategic pricing
- Professional staging
- Strong marketing and photography
Homes that are priced and presented correctly continue to sell—even in a slower seasonal market.
Average List Price
🏷️ Average Asking Price: Sellers Holding Firm
The average asking price in November 2025 was $580,000, down just 0.15% from last year. This minimal adjustment shows that sellers remain confident in their home values, even as the market slows seasonally.
On a year-to-date basis, the average asking price is $560,000, up 4.70% from 2024—confirming that sellers have been pricing their homes higher throughout 2025 and largely achieving those expectations.
St. Albert Home Sales
🏠 Sold Properties: Seasonal Slowdown, Not Weakness
In November 2025, there were 81 residential sales, a 14.74% decrease compared to November 2024. This decline is very much in line with normal seasonal patterns, as buyer activity naturally tapers off heading into December.
What’s important to note is that year-to-date sales are only down 0.56%, which means overall market activity has remained remarkably consistent throughout 2025.
What this tells us:
- Buyers are still present—but more selective
- Transactions are happening with intention, not urgency
- Serious buyers remain active heading into year-end
This is not a sign of market weakness—it’s a shift toward balance.
Average Sale Price of Homes
💰 Average Sale Price: Short-Term Dip, Long-Term Growth
The average sale price in November 2025 was $465,000, representing a 10.41% decrease from November 2024. While this is a noticeable month-over-month drop, it must be viewed in context.
Year-to-date, the average sale price in St. Albert is $522,000, which is up 4.74% compared to 2024.
Why November prices softened:
- Fewer luxury and move-up homes sold in November
- More mid-range and entry-level homes transacted
- Buyers negotiated more firmly as inventory increased
This does not indicate declining property values—rather, it reflects the mix of homes sold during the month.
Days on MLS®
📉 Ask-to-Sell Ratio: Market Near Equilibrium
The average ask-to-sell ratio in November was 0.987, meaning homes sold for about 98.7% of asking price.
Year-to-date, the ratio is 1.001, slightly higher than 2024.
What this means:
- Buyers are negotiating modestly
- Sellers are still achieving close to list price
- The market is balanced, not distressed
This is a healthy environment where both parties can negotiate fairly.
📈 Year-to-Date (YTD) Market Performance – January to November 2025
| Metric | 2025 YTD | 2024 YTD | % Change |
| Homes Sold | 1,419 | 1,427 | -0.56% |
| Average Sale Price | $522,000 | $498,000 | +4.74% |
| Average Asking Price | $560,000 | $535,000 | +4.70% |
| New Listings | 1,942 | 1,800 | +7.89% |
| Days on Market | 41 days | 49 days | -16.33% |
| Ask-to-Sell Ratio | 1.001 | 0.997 | +0.39% |
Despite a modest year-over-year decline in total sales volume, prices are up, homes are selling faster overall, and inventory has increased, giving the St. Albert market a healthy, balanced foundation heading into winter.
🧠 What November’s Market Means for Buyers
November can be one of the best times of year to buy in St. Albert.
Buyer advantages:
- More inventory to choose from
- Less competition and fewer bidding wars
- Greater negotiating leverage
- Motivated sellers before year-end
With prices still up nearly 5% year-to-date, buying now allows purchasers to secure long-term value while benefiting from short-term market softness.
📞 Thinking of buying before the new year?
Call or text (780) 717-5267 to discuss current opportunities.
🏡 What November’s Market Means for Sellers
While November is quieter, it still offers strong opportunities for sellers who price strategically.
Seller advantages:
- Serious, qualified buyers still active
- Less competing inventory than spring markets
- Strong year-to-date pricing benchmarks
- Ability to relist or relaunch in spring if needed
Homes that are priced correctly and professionally marketed continue to sell—even in a slower season.
🌟 Why St. Albert Remains a Strong Long-Term Market
Despite monthly fluctuations, St. Albert continues to stand out due to:
- Excellent schools and family-focused neighbourhoods
- Proximity to Edmonton’s employment centres
- Strong resale values
- Low crime and high livability rankings
- Consistent year-over-year price appreciation
Neighbourhoods such as Jensen Lakes, Erin Ridge, North Ridge, Oakmont, and The Gardens continue to attract buyers looking for stability and lifestyle.
🔮 Looking Ahead to December and Early 2026
As we move into December:
- Inventory is expected to tighten
- Buyer activity will slow but remain focused
- Prices are likely to remain stable
- Early 2026 may see renewed demand
Buyers who act now often enjoy less competition and better terms, while sellers who wait until spring may face more listings—but also more buyers.
🧾 Final Thoughts: A Market Built on Stability
November 2025 reinforces what we’ve seen all year:
St. Albert is not a boom-and-bust market—it’s a steady, equity-driven one.
Short-term seasonal slowdowns are normal, but the year-to-date data confirms:
- Prices are higher
- Homes are selling faster overall
- Inventory growth has improved market balance
This is exactly the type of market buyers and sellers should feel confident operating in.
📞 Your St. Albert Real Estate Expert
If you’re considering buying, selling, or planning for 2026, I’d love to help you navigate your next move with clarity and confidence.
Christina Reid, REALTOR®
📱 (780) 717-5267
📧 creid@chrisreidedmonton.com
🏢 Century 21 Leading
Data provided by the REALTORS® Association of Edmonton and subject to change. Always consult with a real estate professional for the most current market information.
Interested in buying or selling in the St. Albert real estate market CONTACT CHRIS REID
St. Albert Website
Edmonton Detached Single Family Home Market: November 2025 Update
As we move into the final weeks of 2025, the Edmonton detached homes real estate market is clearly reflecting the seasonal shift, with fewer sales, rising days on market, and steady price growth. November tends to be a quieter month, and this year is no different—yet the data shows underlying strength in home values and increased seller activity, positioning Edmonton as a market to watch into early 2026.
Let’s explore the November 2025 market in detail, what’s changed year-over-year, and what it means for buyers and sellers as we close out the year.
📊 Key Stats – Edmonton Detached Homes (November 2025)
| Metric | November 2025 | YoY Change |
| Homes Sold | 628 | ▼ 15.14% |
| Average Sale Price | $540,000 | ▲ 3.63% |
| Average Asking Price | $602,000 | ▲ 1.21% |
| New Listings | 916 | ▲ 14.50% |
| Days on Market | 69 days | ▲ 11.29% |
| Ask-to-Sell Ratio | 0.980 | ▼ 0.50% |
Interactive bar graphs
Edmonton New Single Family Home Listings
🏡 Listings Up Significantly – +14.50% in November
There were 916 new listings in November, a 14.50% increase compared to the same month in 2024. For the year so far, 15,576 detached homes have been listed, up 12.42% year-over-year.
More listings = more options. And while this is good news for buyers, sellers now face greater competition for attention—making high-quality presentation, marketing, and pricing strategy essential.
Average Asking Price
📈 Seller Expectations Stay Strong
The average asking price rose to $602,000 in November, an increase of 1.21% year-over-year. Sellers remain confident in the market, pricing homes based on recent sale trends and YTD averages.
- YTD average asking price: $615,000 vs. $593,000 in 2024 → +3.59%.
This gap between asking and final sale price highlights the growing importance of accurate pricing strategies as buyers become more selective heading into 2026.
🏘️ Detached Sales Dip in November
A total of 628 detached homes sold in November 2025, marking a 15.14% decrease compared to November 2024. This drop, though notable, isn’t unexpected as the market naturally slows entering the winter season. For context, October saw 740 sales, meaning activity has eased significantly from the fall peak.
On a year-to-date basis, 9,300 detached homes have sold across Edmonton, which is down 6.39% from the same time last year
📉 What’s causing the slowdown?
- Seasonality: Fewer buyers actively shop in the final quarter of the year.
- Affordability concerns: Despite modest sale price growth, many buyers remain rate-sensitive.
- Increased supply: More inventory creates longer decision-making timelines.
Average Single Family Home Sale Price
💰 Prices Continue to Rise Despite Fewer Sales
While sales volume has decreased, home values are holding firm—and in some cases, climbing.
- The average sale price in November 2025 was $540,000, up 3.63% from the same month last year.
- Year-to-date, the average sale price stands at $554,000, a 5.34% increase over 2024.
This demonstrates that while buyer activity has slowed, the value of detached homes in Edmonton remains resilient, especially for move-in-ready homes in desirable communities
💬 Negotiation Gap Widens Slightly
The ask-to-sell ratio dipped to 0.980 in November 2025, meaning homes sold for 98% of asking price, on average. That’s a slight decrease of 0.50% from last year. On a YTD basis, the ratio sits at 0.992, almost identical to 2024’s 0.993.
This subtle shift reflects more negotiation power for buyers, especially as inventory builds and days on market rise.
Days on MLS®
⏳ Homes Are Taking Longer to Sell
Detached homes took 69 days on average to sell in November, a jump of 11.29% from November 2024. However, looking at the entire year, the YTD average days on market is 50, which is 9.09% faster than last year’s 55-day average.
The rising DOM in recent months suggests buyers are becoming more cautious. It’s not that the market is weak—it’s just more measured.
Year-to-Date (YTD)
| Metric | 2025 YTD | 2024 YTD | % Change |
| Homes Sold | 9,300 | 9,935 | ▼ 6.39% |
| Average Sale Price | $554,000 | $526,000 | ▲ 5.34% |
| Average Asking Price | $615,000 | $593,000 | ▲ 3.59% |
| New Listings | 15,576 | 13,855 | ▲ 12.42% |
| Days on Market | 50 days | 55 days | ▼ 9.09% |
| Ask-to-Sell Ratio | 0.992 | 0.993 | ▼ 0.07% |
🔍 Edmonton Market Summary: Balanced to Buyer-Leaning
The Edmonton market for detached homes in November can best be described as balanced with a buyer-friendly tilt:
- Prices are holding (and growing YTD), but…
- Fewer sales are closing, and…
- Homes are sitting longer, with increased inventory.
For sellers, this means you need to stand out. For buyers, this is an excellent opportunity to find value with less pressure to compete.
🧠 Buyer Tips for Year-End 2025
If you're planning to buy a home in Edmonton, the current conditions are in your favour. Here's how to take advantage of the market:
✅ Benefits:
- More listings = more options.
- Slight negotiation room.
- Less urgency = more time to inspect and evaluate.
⚠️ Challenges:
- Interest rates may still affect your budget.
- Prime homes still attract attention and may sell quickly.
🛠️ Strategy:
- Get pre-approved and know your budget.
- Be prepared to act on well-priced homes.
- Work with an agent who knows neighbourhood trends.
💼 Seller Tips: End-of-Year Success
Sellers need to be more strategic now than they were in spring or summer. Here's how to position your home for a winter sale:
✅ What’s Working:
- Homes priced right are still moving.
- Staging matters more with longer DOM.
- Serious buyers = fewer showings, but higher intent.
⚠️ What to Avoid:
- Overpricing will lead to stagnation.
- Poor presentation will cost you potential offers.
📣 Pro Tip:
Invest in professional photos, virtual tours, and curb appeal. Your home needs to shine—especially when listed alongside 900+ others.
🔮 Looking Ahead to 2026
As 2025 winds down, here’s what we anticipate:
- Listings will slow through December, with most sellers waiting until spring.
- Buyers will hold off for now, but will re-emerge in Q1 once new inventory hits.
- Prices will likely stay stable, but the trend of slower sales may continue into early 2026.
With strong fundamentals and affordable pricing compared to other Canadian cities, Edmonton remains a solid market for long-term investment.
📞 Let's Talk Edmonton Real Estate
Whether you're planning to buy in the new year, sell this winter, or simply want to understand your home's market value, I'm here to help.
📱 Call or Text: (780) 717‑5267
📧 Email: creid@chrisreidedmonton.com
🌐 Visit: chrisreidedmonton.com
Let’s build a real estate strategy that fits your life.
Data provided by the REALTORS® Association of Edmonton and subject to change. Always consult with a real estate professional for the most current market information.
If you would like more information on buying and selling single family homes in Edmonton CONTACT CHRIS REID
City of Edmonton Website
Parkland County Acreage Market Overview: November 2025
In November the Parkland County acreage market saw notable changes to the rural real estate landscape, and understanding the data can help you make informed decisions. Whether you're searching for more space, a quieter lifestyle, or the perfect hobby farm, this market update gives you the insights you need.
I'm Christina Reid, your local acreage real estate expert with Century 21 Leading, and I'm here to guide you through what’s happening in Parkland County’s unique acreage market.
📞 Contact me today at (780) 717‑5267 to get started on your real estate journey.
📊 November 2025 Summary – Parkland County Acreages
| Metric | November 2025 | November 2024 | % Change |
|---|---|---|---|
| Sold Properties | 21 | 38 | ↓ 44.74% |
| New Listings | 19 | 41 | ↓ 53.66% |
| Average Asking Price | $1,130,000 | $1,013,000 | ↑ 11.52% |
| Average Sale Price | $740,000 | $752,000 | ↓ 1.54% |
| Days on Market | 121 days | 69 days | ↑ 75.36% |
| Ask-to-Sell Ratio | 94.9% | 96.7% | ↓ 1.88% |


Below Graphs Are Interactive
Parkland County Acreage Listings
📉 New Listings: Fewer Sellers Entering the Market
Only 19 new acreage listings came to market in November, marking a 53.66% drop compared to November 2024
Average List Price
🏷️ Average Asking Price: Sellers Staying Confident
In November 2025, the average asking price for acreages in Parkland County was $1.13 million, showing a strong 11.52% increase compared to the same time last year
Parkland County Acreage Sales
📉 Acreage Sales in Parkland County: November 2025
The month of November saw 21 acreages sold, a 44.74% decrease compared to the same month in 2024. This steep decline in sales suggests that buyer activity may be softening as we head into the winter season.
Year-to-Date Sales Remain Stable
Despite the slowdown this month, year-to-date (YTD) sales remained stable with 440 properties sold in 2025 compared to 441 in 2024, marking a minimal 0.23% decline. This tells us that the market has remained resilient over the course of the year.
Parkland County Average Sale Price
💰 Average Sale Price: Small Dip in November
While asking prices increased, the average sale price in November slightly decreased to $740,000, which is a 1.54% decline compared to November 2024.
YTD Sale Price Up Over 5%
Despite the monthly dip, the YTD average sale price climbed to $752,000, up from $713,000 last year—an impressive 5.54% year-over-year increase. This trend signals that properties are still achieving higher values over the long run, even if some negotiation is occurring at the time of sale.
📈 Average Ask-to-Sell Ratio: Slight Market Shift
The average ask-to-sell ratio dropped to 94.9% in November, down 1.88% compared to last year. This means buyers are negotiating prices a bit more aggressively, resulting in sales happening below the asking price on average.
YTD Ratio Still Stable
Year-to-date, the ask-to-sell ratio stands at 98.3%, a slight uptick from 98% in 2024. This shows that despite a softer November, the market has maintained relative stability when it comes to pricing expectations.
Average Days on MLS®
📊 Days on Market: Buyers Taking Longer to Decide
One of the most significant changes in November was the average number of days on market, which jumped to 121 days—a 75.36% increase from November 2024.
Faster Sales YTD
Interestingly, YTD numbers tell a different story. In 2025, acreages spent an average of 66 days on market, which is 25% faster than the 88-day average in 2024. The longer timelines in November may reflect seasonal slowdowns or cautious buyer sentiment toward the end of the year.
📅 Year-to-Date (YTD) Comparison Table
Here’s how the Parkland County acreage market compares year-over-year:
| Metric | 2025 YTD | 2024 YTD | % Change |
| Sold Properties | 440 | 441 | ↓ 0.23% |
| New Listings | 648 | 709 | ↓ 8.60% |
| Average Asking Price | $879,000 | $870,000 | ↑ 1.03% |
| Average Sale Price | $752,000 | $713,000 | ↑ 5.54% |
| Days on Market | 66 | 88 | ↓ 25.00% |
| Ask-to-Sell Ratio | 98.3% | 98.0% | ↑ 0.33% |
🛠️ What This Means for Buyers
- Opportunity to negotiate: With sale prices slightly lower than asking and days on market rising in November, buyers have a bit more leverage.
- Less inventory: Fewer listings mean competition is still present for well-priced and well-presented acreages.
- Rising values long-term: YTD sale prices are up, which supports long-term investment in rural real estate.
Now is a great time to start your search while competition is still manageable.
🏡 What This Means for Sellers
- Strong pricing trends: Asking prices are trending higher and YTD sale prices are up—good news for sellers.
- Longer timelines: Be prepared for slightly longer selling periods, particularly in winter.
- Marketing matters: With fewer listings and fewer sales, your property needs to stand out. Professional photos, acreage staging, and aerial tours can help you capture buyer interest.
📲 Let’s discuss a personalized pricing and marketing strategy tailored to your property and goals.
🔮 Looking Ahead to December and 2026
As we move into the final month of the year, expect continued seasonal slowdowns. However, if 2025’s overall trends are any indication, acreage sales in Parkland County remain strong, with long-term growth in values and solid performance across the board.
If you’re considering a move in early 2026, now is the perfect time to start planning. Let’s talk about prepping your property or beginning your acreage search.
📞 Ready to Make a Move?
Whether you're ready to list your acreage, buy your dream rural property, or just want to understand your options, I’m here to help.
👋 Christina Reid – REALTOR®
📱 (780) 717‑5267
📧 creid@chrisreidedmonton.com
🌐 chrisreidedmonton.com
Let’s turn your real estate goals into reality. I specialize in Parkland County acreages, and I would be honoured to be your trusted guide in this beautiful rural community.
Data provided by the REALTORS® Association of Edmonton and subject to change. Always consult with a real estate professional for the most current market information.
If you would like more information on buying and selling in Parkland County CONTACT CHRIS REID
Edmonton Real Estate Market Update – November 2025
The Edmonton real estate market continues to show remarkable resilience and steady performance. The November 2025 statistics reveal a well-balanced market with year-over-year growth in many key areas—offering both opportunities and insights for buyers, sellers, and investors alike.
In this month’s Edmonton real estate update, we’ll dive into the latest market performance, compare it to October 2025, and review year-to-date trends in 2025 versus 2024. Whether you’re planning to make a move before year-end or considering your strategy for early 2026, these numbers will help guide your decision.
📊 Quick Snapshot: November 2025 Market Highlights
- Total Residential Unit Sales: 1,637 (↑ 28.5% YoY)
- Average Sale Price (All Residential): $388,637 (↑ 0.7% MoM | ↑ 5.0% YoY)
- Average Days on Market: 46 Days (↓ 11 Days YoY)
- Total New Listings: 2,103 (↑ 9.9% YoY)
- Total Inventory: 5,377 (↓ 14.5% YoY)
These figures show that despite seasonal slowdowns often expected in Q4, November 2025 outperformed expectations. Demand remained strong, inventory levels continued to tighten, and prices remained firm.
📈 Month-Over-Month Comparison: October vs. November 2025
| Metric | October 2025 | November 2025 | % Change |
| Total Residential Sales | 1,812 | 1,637 | ↓ 9.6% |
| Average Residential Price | $386,607 | $388,637 | ↑ 0.5% |
| New Listings | 2,384 | 2,103 | ↓ 11.8% |
| Inventory | 5,935 | 5,377 | ↓ 9.4% |
| Average Days on Market | 45 | 46 | ↑ 2.2% |
While sales dipped slightly from October to November—a seasonal norm—the average price rose modestly, signalling continued buyer interest. Lower inventory may contribute to some upward price pressure going into 2026.


Below Graphs Are Interactive.
Edmonton New MLS® Listings
📈 New Listings Continue to Climb
November brought a steady supply of fresh inventory to the Edmonton housing market. A total of 2,103 new listings hit the market, which is a 9.9% increase compared to November 2024. Although this is a seasonal dip from October's 2,384 new listings, it still reflects strong seller confidence. This consistent stream of new properties gives buyers more choices while helping balance supply and demand as we move toward winter.
Average List Price Edmonton Real Estate Market
💰 Average Asking Price Shows Market Confidence
The average list price in November 2025 across all residential property types was $398,847. This figure not only marks a slight uptick from October’s average but also underscores seller optimism, likely driven by ongoing buyer activity and competitive demand in popular neighbourhoods. Sellers are pricing homes aggressively but realistically, contributing to overall market stability.
Home Sales In The Edmonton Real Estate Market
🔥 Home Sales Up Significantly from 2024
A total of 1,637 homes were sold in Edmonton during November 2025, which represents a 28.5% increase from November 2024. This surge in sales is particularly impressive for a traditionally slower month and reflects pent-up demand, favourable lending conditions, and a strong job market fueling housing activity. Whether you're a buyer or seller, the numbers signal confidence in the city's housing market.
Edmonton Average Home Sale Price
🏡 Average Sale Prices Holding Strong
Buyers in the Edmonton market remained active, and that momentum translated into strong sale prices. The average sale price across all residential categories reached $388,637, a 0.5% increase month-over-month and a 5.0% year-over-year gain. This upward trend shows Edmonton’s market remains healthy and attractive to both local and out-of-town buyers, particularly as prices remain more affordable compared to other Canadian cities.
Edmonton Real Estate Market -Average Days
⏱️ Homes Selling Faster Than Last Year
Homes in Edmonton are moving off the market at a quicker pace. The average days on market (DOM) in November was 46 days, which is just one day longer than in October 2025. However, this is 11 days faster than November 2024, showcasing how today’s buyers are prepared, motivated, and acting decisively. This reduction in DOM is a great sign for sellers looking for timely transactions.
🗓️ Year-to-Date Comparison: 2025 vs 2024
Here’s a deeper look at how 2025 stacks up against 2024:
| Metric | 2025 YTD | 2024 YTD | % Change |
| Total Residential Sales | 21,206 | 19,607 | ↑ 8.15% |
| Average Sale Price | $400,646 | $388,637 | ↑ 3.09% |
| Average DOM | 44 | 49 | ↓ 10.2% |
| New Listings | 29,685 | 30,776 | ↓ 3.6% |
| Total Inventory (Nov) | 5,377 | 6,289 | ↓ 14.5% |
The 2025 YTD numbers paint a picture of a market with higher demand and fewer listings, leading to a tighter supply environment. The result? Properties are selling faster and at higher prices, especially in the detached and semi-detached segments.
🏠 Market Segment Performance
Let’s break down the key property types across Edmonton.
📌 Detached Homes
- Sales: 967 units (↑ 33.1% YoY)
- Average Price: $486,751 (↑ 3.9% YoY)
- DOM: 42 Days
Detached homes remain the most sought-after property type in Edmonton. With strong year-over-year gains in both sales and price, this segment continues to drive the overall market.
📌 Semi-Detached Homes
- Sales: 224 units (↑ 25.8% YoY)
- Average Price: $373,180 (↑ 1.4% YoY)
- DOM: 38 Days
Semi-detached homes offer a great middle ground for buyers—providing more space than townhomes, often at a better value than detached properties. Demand is up significantly, and pricing remains competitive.
📌 Row/Townhouses
- Sales: 214 units (↑ 6.5% YoY)
- Average Price: $266,819 (↑ 1.6% YoY)
- DOM: 45 Days
The townhouse segment saw modest growth in both price and sales. These properties appeal to first-time buyers and downsizers alike, and that demand is keeping prices stable.
📌 Apartment Condominiums
- Sales: 232 units (↑ 31.8% YoY)
- Average Price: $194,767 (↓ 3.4% YoY)
- DOM: 59 Days
Despite a significant increase in unit sales, average condo prices continue to decline. This may be an opportunity for investors or entry-level buyers to purchase at a discount while the rest of the market rises.
🧭 What’s Driving the Market?
Several key factors are shaping Edmonton’s real estate trends:
✔️ Migration & Population Growth
As more Canadians look for affordable alternatives to BC and Ontario, Alberta—and Edmonton in particular—is experiencing strong interprovincial migration. The relatively low cost of housing, high quality of life, and stable job market are all major draws.
✔️ Tight Inventory
With new listings down 3.6% YTD and inventory levels dropping significantly, the market has tilted toward sellers. Buyers are acting quickly when well-priced homes hit the market.
✔️ Resilient Economy
Alberta’s economy continues to show strength, particularly in the energy, construction, and technology sectors. Low unemployment rates and strong wage growth are contributing to buyer confidence.
💡 What This Means for Buyers
- Competition is still present, especially in popular neighbourhoods and price points under $500,000.
- Rates remain a consideration: With interest rates stabilizing, many buyers are feeling confident locking in fixed rates to secure their next home.
- Act quickly and be prepared: Homes are selling faster, especially in the detached and semi-detached segments. Pre-approvals and flexibility on possession dates can make your offer more attractive.
💼 What This Means for Sellers
- Detached homes are in high demand, with many listings receiving strong attention if priced properly.
- Well-staged, professionally marketed homes are moving quickly, even late in the year.
- Fewer listings = less competition: If you’re thinking of selling in 2026, it might be worth exploring now, especially if you have a quick possession home ready.
🔮 Looking Ahead to December and Early 2026
As we enter the final month of the year, seasonal trends will likely lead to a slowdown in listings and activity. However, motivated buyers remain active, especially those relocating or trying to lock in a property before interest rate changes in the new year.
Expect a brisk start to 2026 as pent-up demand returns in January, supported by a tighter supply of homes and growing buyer confidence.
📞 Let’s Chat About Your Real Estate Goals
Whether you’re buying your first home, moving up, downsizing, or investing in Edmonton real estate, I’m here to help you make informed, confident decisions.
Reach out today for a personalized strategy tailored to your unique situation. From home evaluations to new construction opportunities and resale insights—I’ve got your back.
📲 Call/Text: (780) 717-5267
📧 Email: chris.reid@century21.ca
🌐 Website: www.chrisreidedmonton.com
Let’s make your next move the right one!
Data provided by the REALTORS® Association of Edmonton and subject to change. Always consult with a real estate professional for the most current market information.
Looking to buy or sell in Edmonton? CONTACT CHRIS REID
City of Edmonton Website
Spruce Grove Real Estate Market Update November 2025
The Spruce Grove real estate market continues to shift in expected seasonal ways—with a drop in sales volume, longer days on market, and moderated pricing momentum. Yet, inventory levels remain strong, and year-over-year gains in sale price and new listings reflect long-term confidence in this vibrant community.
Whether you're looking to buy, sell, or invest, here’s a detailed breakdown of what happened in the Spruce Grove housing market in November 2025, and what it means for your real estate goals as we head into the final month of the year.
📊 November 2025 Market Snapshot
| Metric | November 2025 | November 2024 | % Change |
| Sold Properties | 60 | 65 | ↓ 7.69% |
| YTD Sold Properties | 1,056 | 1,173 | ↓ 9.97% |
| Average Asking Price | $495,000 | $496,450 (approx.) | ↓ 0.29% |
| YTD Avg Asking Price | $504,000 | $466,000 | ↑ 8.14% |
| Average Sale Price | $462,000 | $461,400 (approx.) | ↑ 0.13% |
| YTD Avg Sale Price | $475,000 | $431,000 | ↑ 10.09% |
| New Listings | 105 | 80 | ↑ 31.25% |
| YTD New Listings | 1,535 | 1,456 | ↑ 5.43% |
| Days on Market | 70 days | 64 days (approx.) | ↑ 9.38% |
| Ask-to-Sell Ratio | 0.989 | 0.991 (approx.) | ↓ 0.23% |


The below graphs are interactive
New MLS® Listing Count
📦 New Listings Surge in November
Interestingly, while sales slowed, new listings jumped by 31.25% this month with 105 properties hitting the market, compared to just 80 in November 2024. That brings the year-to-date total to 1,535 listings, up 5.43% from last year.
This unexpected surge in late-season inventory may be the result of sellers trying to capture buyers still active before the year ends or positioning themselves early for 2026. For buyers, this creates more negotiating power and a broader pool of properties to consider.
Average Listing Price in Spruce Grove
💰 Average Asking Price: Flat but Holding Strong
The average asking price in November 2025 was $495,000, virtually flat from the previous year (down just 0.29%). This pause in price growth may reflect seller adjustments in response to slower buyer demand.
Despite the monthly dip, the year-to-date average asking price is $504,000, which is 8.14% higher than in 2024. That means overall seller confidence remains strong, though flexibility and pricing accuracy are becoming more important in attracting buyers.
Spruce Grove Home Sales
📉 Sales Activity Slows Further in November
A total of 60 homes were sold in Spruce Grove in November 2025, down 7.69% from the same month last year. This seasonal drop in activity is typical for the time of year as both buyers and sellers start shifting focus toward the holidays.
On a year-to-date basis, 1,056 properties have sold, which is nearly 10% fewer than in 2024. This continuing trend of reduced transactions signals a cooling market, though not necessarily a weak one—it reflects a return to more normal levels following several years of unusual volatility.
Real Estate Market Statistics Spruce Grove Average Home Sale Price
📈 Average Sale Price: Modest Monthly Rise, Strong YTD Gains
The average sale price in November 2025 was $462,000, marking a very modest 0.13% increase from the previous year. However, year-to-date sale prices continue to impress with a 10.09% rise, now sitting at $475,000 compared to $431,000 in 2024.
While we may be moving into a plateau period, the cumulative gains made this year reflect the strength of the Spruce Grove market over the longer term.
⚖️ Ask-to-Sell Ratio: Small Decline Signals More Negotiation
The average ask-to-sell ratio was 0.989 in November, down slightly from 0.991. This means that, on average, homes sold for about 1.1% below the list priceWhile that’s not a massive change, it does reinforce the shifting leverage toward buyers, particularly as inventory grows and homes sit on the market longer. Sellers should work closely with their REALTOR® to fine-tune pricing and expectations in this environment.
Days on Market Until Sale
⏳ Days on Market: Buyers Taking More Time
The average home in Spruce Grove took 70 days to sell in November, up 9.38% from 64 days the year before. That’s the highest average days on market we’ve seen in 2025, and it’s an important signal that buyers are being more cautious.
However, year-to-date numbers still look good—homes are selling in an average of 52 days in 2025, which is 10.34% faster than last year. This could be the result of quick spring and summer sales that are balancing out the longer fall timelines.
🧭 What This Means for Buyers
The market is becoming more favourable for buyers as we close out the year. With higher inventory, longer days on market, and more negotiation room, this is a great time to take your time, explore options, and find value.
Buyer Tips:
- Use the slower season to your advantage—less competition means more room to negotiate.
- Get pre-approved so you can move quickly if you find the right home.
- Work with a local expert to help identify properties that may have been sitting longer and offer potential savings.
📲 Ready to start your home search? Call Christina Reid at (780) 717-5267 today and let’s map out your 2026 home goals.
💡 What This Means for Sellers
It’s still possible to sell successfully this winter, but the strategy must shift. With longer timelines and more listings available, presentation and pricing are more critical than ever.
Seller Tips:
- Consider listing early in the new year to beat the spring rush.
- Ensure your home is move-in ready—buyers will be more selective.
- Be open to reasonable offers and work with an agent to handle negotiations confidently.
📞 Thinking of selling this winter or early 2026? Let’s talk strategy. Contact Christina Reid at (780) 717-5267 for a free consultation.
📊 YTD Comparison – 2025 vs. 2024
| Metric | 2025 YTD | 2024 YTD | % Change |
| Sold Properties | 1,056 | 1,173 | ↓ 9.97% |
| Average Asking Price | $504,000 | $466,000 | ↑ 8.14% |
| Average Sale Price | $475,000 | $431,000 | ↑ 10.09% |
| New Listings | 1,535 | 1,456 | ↑ 5.43% |
| Days on Market | 52 | 58 | ↓ 10.34% |
| Ask-to-Sell Ratio | 0.999 | 0.994 | ↑ 0.42% |
spruce
🌇 Spruce Grove Market Outlook
Even as activity slows, Spruce Grove remains a top-tier market in the Edmonton region thanks to:
- Family-friendly neighbourhoods like Prescott, Greenbury, Fenwyck, and Harvest Ridge.
- Great commute access via Highway 16.
- Quality schools, recreation, and shopping all within reach.
- Modern housing options with better price-per-square-foot value than urban centres.
📞 Work with Christina Reid – Local Expertise, Trusted Results
Navigating seasonal shifts and pricing trends requires hyper-local expertise. Whether you're thinking of buying, selling, or investing in Spruce Grove real estate, I’m here to help you make confident decisions every step of the way.
📱 Call/Text: (780) 717-5267
📧 Email: creid@chrisreidedmonton.com
🌐 Website: chrisreidedmonton.com
Data provided by the REALTORS® Association of Edmonton and subject to change. Always consult with a real estate professional for the most current market information.
City of Spruce Grove Website
Stony Plain Real Estate Market Update: November 2025
The Stony Plain real estate market continues to demonstrate resilience and balance, even as sales activity slows seasonally. November 2025 brought encouraging signs for both buyers and sellers — steady price growth, a modest uptick in monthly sales, and shorter selling times compared to last year.
While many markets across Alberta are beginning to cool heading into the winter months, Stony Plain’s steady performance underscores its reputation as one of the region’s most stable and desirable real estate communities.
This in-depth analysis breaks down how the market performed in November and what the latest numbers mean for anyone buying, selling, or investing in Stony Plain real estate.
📊 November 2025 Market Snapshot
| Metric | November 2025 | November 2024 | % Change |
| Sold Properties | 26 | 25 | +4.00% |
| YTD Sold Properties | 430 | 470 | -8.51% |
| Average Asking Price | $441,000 | $422,000 (est.) | +4.59% |
| YTD Average Asking Price | $435,000 | $404,000 | +7.52% |
| New Listings | 44 | 42 | +4.76% |
| YTD New Listings | 560 | 573 | -2.27% |
| Average Days on Market | 41 | 62 | -33.87% |
| YTD Days on Market | 46 | 52 | -11.54% |
| Average Sale Price | $418,000 | $388,000 (est.) | +7.71% |
| YTD Average Sale Price | $406,000 | $379,000 | +7.14% |
| Ask-to-Sell Ratio | 98.2% | 97.0% | +1.20% |
| YTD Ask-to-Sell Ratio | 99.1% | 98.8% | +0.22% |
Below Graphs Are Interactive
Stony Plain Real Estate - New MLS® Listings
🔹 New Listings Show Slight Growth
In November, 44 new listings hit the market — a 4.76% increase compared to November 2024. While this is a minor improvement, it provides some breathing room for buyers who have been facing tight inventory in earlier months.
Overall, YTD listings remain down slightly, with 560 new homes listed, compared to 573 in 2024, a 2.27% decline.
This combination of steady new listings and continued price growth suggests strong demand meeting limited supply — one of the defining traits of a stable, appreciating market.
Average Asking Price of Homes in Stony Plain
🔹 Asking Prices Continue to Rise
The average asking price hit $441,000 in November, up 4.59% from the previous year. This upward movement in list prices aligns with the consistent sale price growth, indicating that sellers remain confident in the market’s health
stony plain
.
YTD, the average asking price stands at $435,000, up 7.52% from 2024. Even as market conditions normalize, Stony Plain sellers continue to price competitively, reflecting confidence and sustained buyer interest.
Stony Plain Home Sales
🔹 Sales Edge Up Slightly
November saw 26 properties sold, up 4% from the same month in 2024. Although modest, this increase is notable given that sales traditionally taper off as the weather cools and buyers pause for the holidays.
Year-to-date (YTD), 430 homes have sold, representing an 8.51% decline compared to the same time last year. However, considering the strong start to 2025 and consistent pricing, Stony Plain remains a balanced market that continues to attract steady buyer activity.
Stony Plain Real Estate Market- Average Home Sale Price
🔹 Average Sale Price Sees Healthy Gains
The average sale price for November 2025 reached $418,000, reflecting a 7.71% increase over November 2024.
On a YTD basis, home prices have averaged $406,000, marking a 7.14% increase compared to 2024. This sustained growth confirms that property values in Stony Plain continue to strengthen, supported by steady demand and limited new inventory.
For homeowners, this means strong equity growth year-over-year — and for buyers, it signals that home values are holding firm, making Stony Plain a reliable choice for long-term investment.
🔹 Ask-to-Sell Ratio Strengthens
The average ask-to-sell ratio — which measures how close homes sell to their asking price — rose to 98.2% in November, a 1.20% increase compared to 2024.
On a YTD basis, the ratio sits at 99.1%, up slightly from last year’s 98.8%. This means that homes in Stony Plain continue to sell for nearly their full list price — a clear sign of a healthy and balanced market.
Stony Plain Average Days on Market
🔹 Homes Selling Faster Than Last Year
One of the most positive indicators in November 2025 is the sharp reduction in average days on market.
Homes sold in an average of 41 days, compared to 62 days in November 2024 — a 33.87% decrease. This means properties are selling about three weeks faster than they were at this time last year.
On a YTD scale, the trend continues to favour sellers, with homes selling in 46 days on average, down 11.54% from 52 days in 2024. This shows that motivated buyers remain active even as the year winds down.
| Metric | 2025 YTD | 2024 YTD | % Change |
|---|---|---|---|
| Sold Properties | 430 | 470 | -8.51% |
| Average Asking Price | $435,000 | $404,000 | +7.52% |
| New Listings | 560 | 573 | -2.27% |
| Average Days on Market | 46 days | 52 days | -11.54% |
| Average Sale Price | $406,000 | $379,000 | +7.14% |
| Ask-to-Sell Ratio | 99.1% | 98.8% | +0.22% |
🏘️ What This Means for Buyers
For homebuyers, November 2025 represents a strategic opportunity. While overall sales have slowed seasonally, the underlying market remains competitive — but not overheated.
- More Choice, Less Rush: With new listings slightly up, buyers can take a bit more time to explore available homes.
- Stable Pricing: The continued rise in sale prices shows that Stony Plain’s housing market remains a solid investment.
- Faster Sales = Serious Competition: Although homes are moving faster, they’re not flying off the market immediately, allowing prepared buyers to act confidently.
- Winter Timing Advantage: Entering the market now can offer buyers less competition than the spring surge, often leading to better negotiating opportunities.
🏡 What This Means for Sellers
For sellers, November 2025 remains a favourable environment to list a home — even as the year winds down.
- Homes Are Selling Quicker: A 34% drop in days on market means listings are drawing attention faster than last year.
- Prices Are Strong: With both asking and sale prices trending up, sellers continue to command excellent returns.
- Low Competition: With fewer active listings than in past years, your property has a higher chance of standing out.
- Buyer Confidence Is High: Stony Plain’s consistent year-over-year price growth and near-asking-price sales show buyers remain motivated.
If you’re thinking of listing soon, early winter may offer a golden window of opportunity — before new listings flood the market in early 2026.
🌟 Why Stony Plain Continues to Attract Buyers
Stony Plain offers the perfect mix of affordability, convenience, and community appeal. Homebuyers continue to choose this thriving town for its:
- Proximity to Edmonton: Just a short drive from the city, it provides easy access to work, amenities, and entertainment.
- Family-Friendly Neighbourhoods: With excellent schools, parks, and recreation centres, it’s an ideal place to raise a family.
- Value Growth: Year-over-year appreciation and low market volatility make Stony Plain a smart investment location.
- Community Feel: With local events, heritage charm, and friendly neighbourhoods, it provides a true small-town atmosphere.
🔮 Looking Ahead to Winter 2025–2026
As 2025 winds down, the Stony Plain real estate market is poised to enter the new year with healthy momentum.
We can expect:
- Stable Prices: Home values should remain firm through winter as inventory stays low.
- Seasonal Slowdown in Sales: A natural dip in transactions is expected over December and January before spring brings renewed activity.
- Continued Buyer Confidence: Interest rates and affordability remain key factors influencing early 2026 demand.
For both buyers and sellers, this is an ideal time to prepare for next year’s market — whether that means getting pre-approved, planning upgrades, or scheduling an early spring listing strategy.
📊 Stony Plain YTD Market Comparison (January–November)
| Metric | 2025 YTD | 2024 YTD | % Change |
| Sold Properties | 430 | 470 | -8.51% |
| Average Asking Price | $435,000 | $404,000 | +7.52% |
| New Listings | 560 | 573 | -2.27% |
| Average Days on Market | 46 days | 52 days | -11.54% |
| Average Sale Price | $406,000 | $379,000 | +7.14% |
| Ask-to-Sell Ratio | 99.1% | 98.8% | +0.22% |
Overall, 2025 continues to outperform 2024 in pricing and efficiency.
Even with slightly fewer listings and total sales, Stony Plain’s consistent year-over-year growth positions it as a steady and rewarding market for both homeowners and investors.
📞 Let’s Talk About Your Real Estate Goals
Whether you’re considering buying or selling, having the right strategy — and the right REALTOR® — makes all the difference.
I’m Chris Reid, REALTOR® with Century 21 Leading, and I specialize in helping clients in Stony Plain and the surrounding areas navigate their real estate journeys with confidence and data-driven insight.
📱 Call or Text: (780) 717-5267
📧 Email: creid@chrisreidedmonton.com
Let’s create your next real estate success story in Stony Plain.
Data provided by the REALTORS® Association of Edmonton and subject to change. Always consult with a real estate professional for the most current market information.
If you are considering buying or selling a home in Stony Plain or just want more information on the Stony Plain real estate market, CONTACT ME HERE.
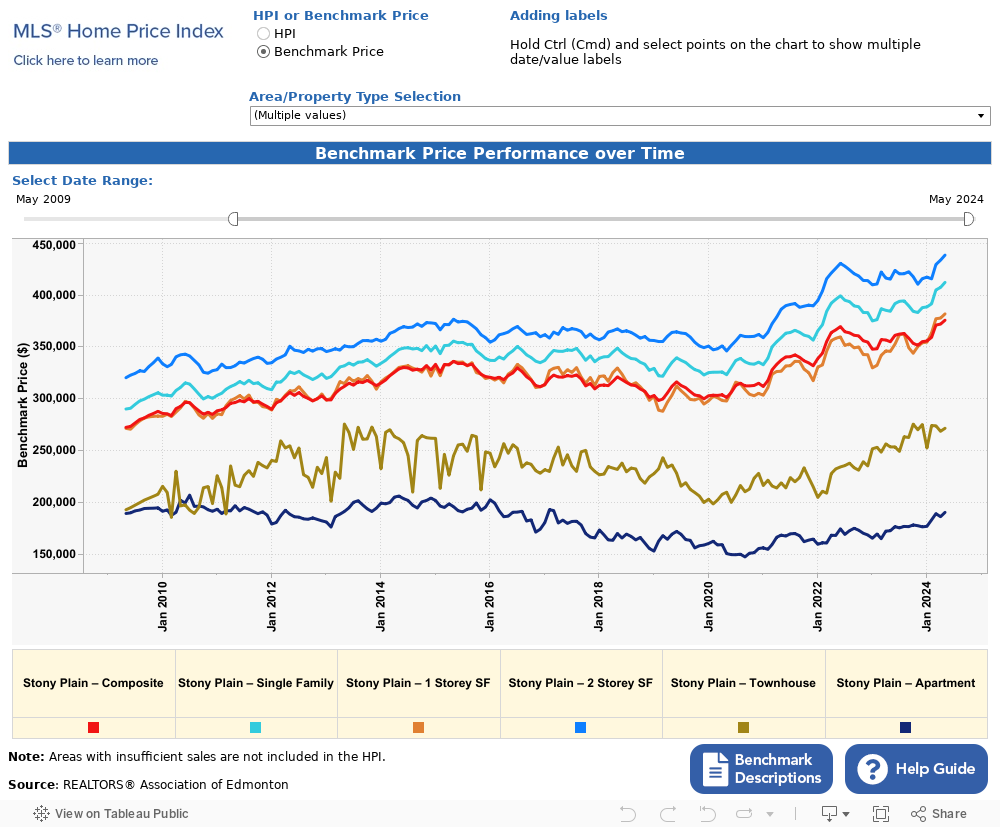
CENTURY 21 Leading
INFO & SERVICES
CENTURY 21 Leading
14315 118 Ave NW, Unit 130, Edmonton, AB T5L4S6
(780) 455-0777
INFO & SERVICES

Independently Owned and Operated. ®/™ trademarks owned by Century 21 Real Estate LLC used under license or authorized sub-license. © 2020 Century 21 Canada Limited Partnership © 2020 Century 21 Canada Limited Partnership
The trademarks MLS®, Multiple Listing Service® and the associated logos identify professional services rendered by REALTOR® members of CREA to effect the purchase, sale and lease of real estate as part of a cooperative selling system. The trademarks REALTOR ® , REALTORS ® and the REALTOR ® logo are controlled by The Canadian Real Estate Association (CREA) and identify real estate professionals who are members of CREA. Used under license. This listing content provided by REALTOR.ca has been licensed by REALTOR® members of The Canadian Real Estate Association. Not intended to solicit properties currently listed for sale or buyers under contract.
Century 21 Canada Limited Partnership currently has franchise opportunities available in select markets across Canada. The intent of this communication is for informational purposes only and is not intended to be a solicitation to anyone under contract with another real estate brokerage operation. This e-mail message contains confidential information intended only for the use of the individual or entity named above. Any unauthorized use or disclosure is strictly prohibited. If you have received this communication in error please immediately delete the e-mail and either notify the sender at the above e-mail address or by telephone.
© 2026 MoxiWorks
