Facebook
 X
X
 Pinterest
 Copy Link
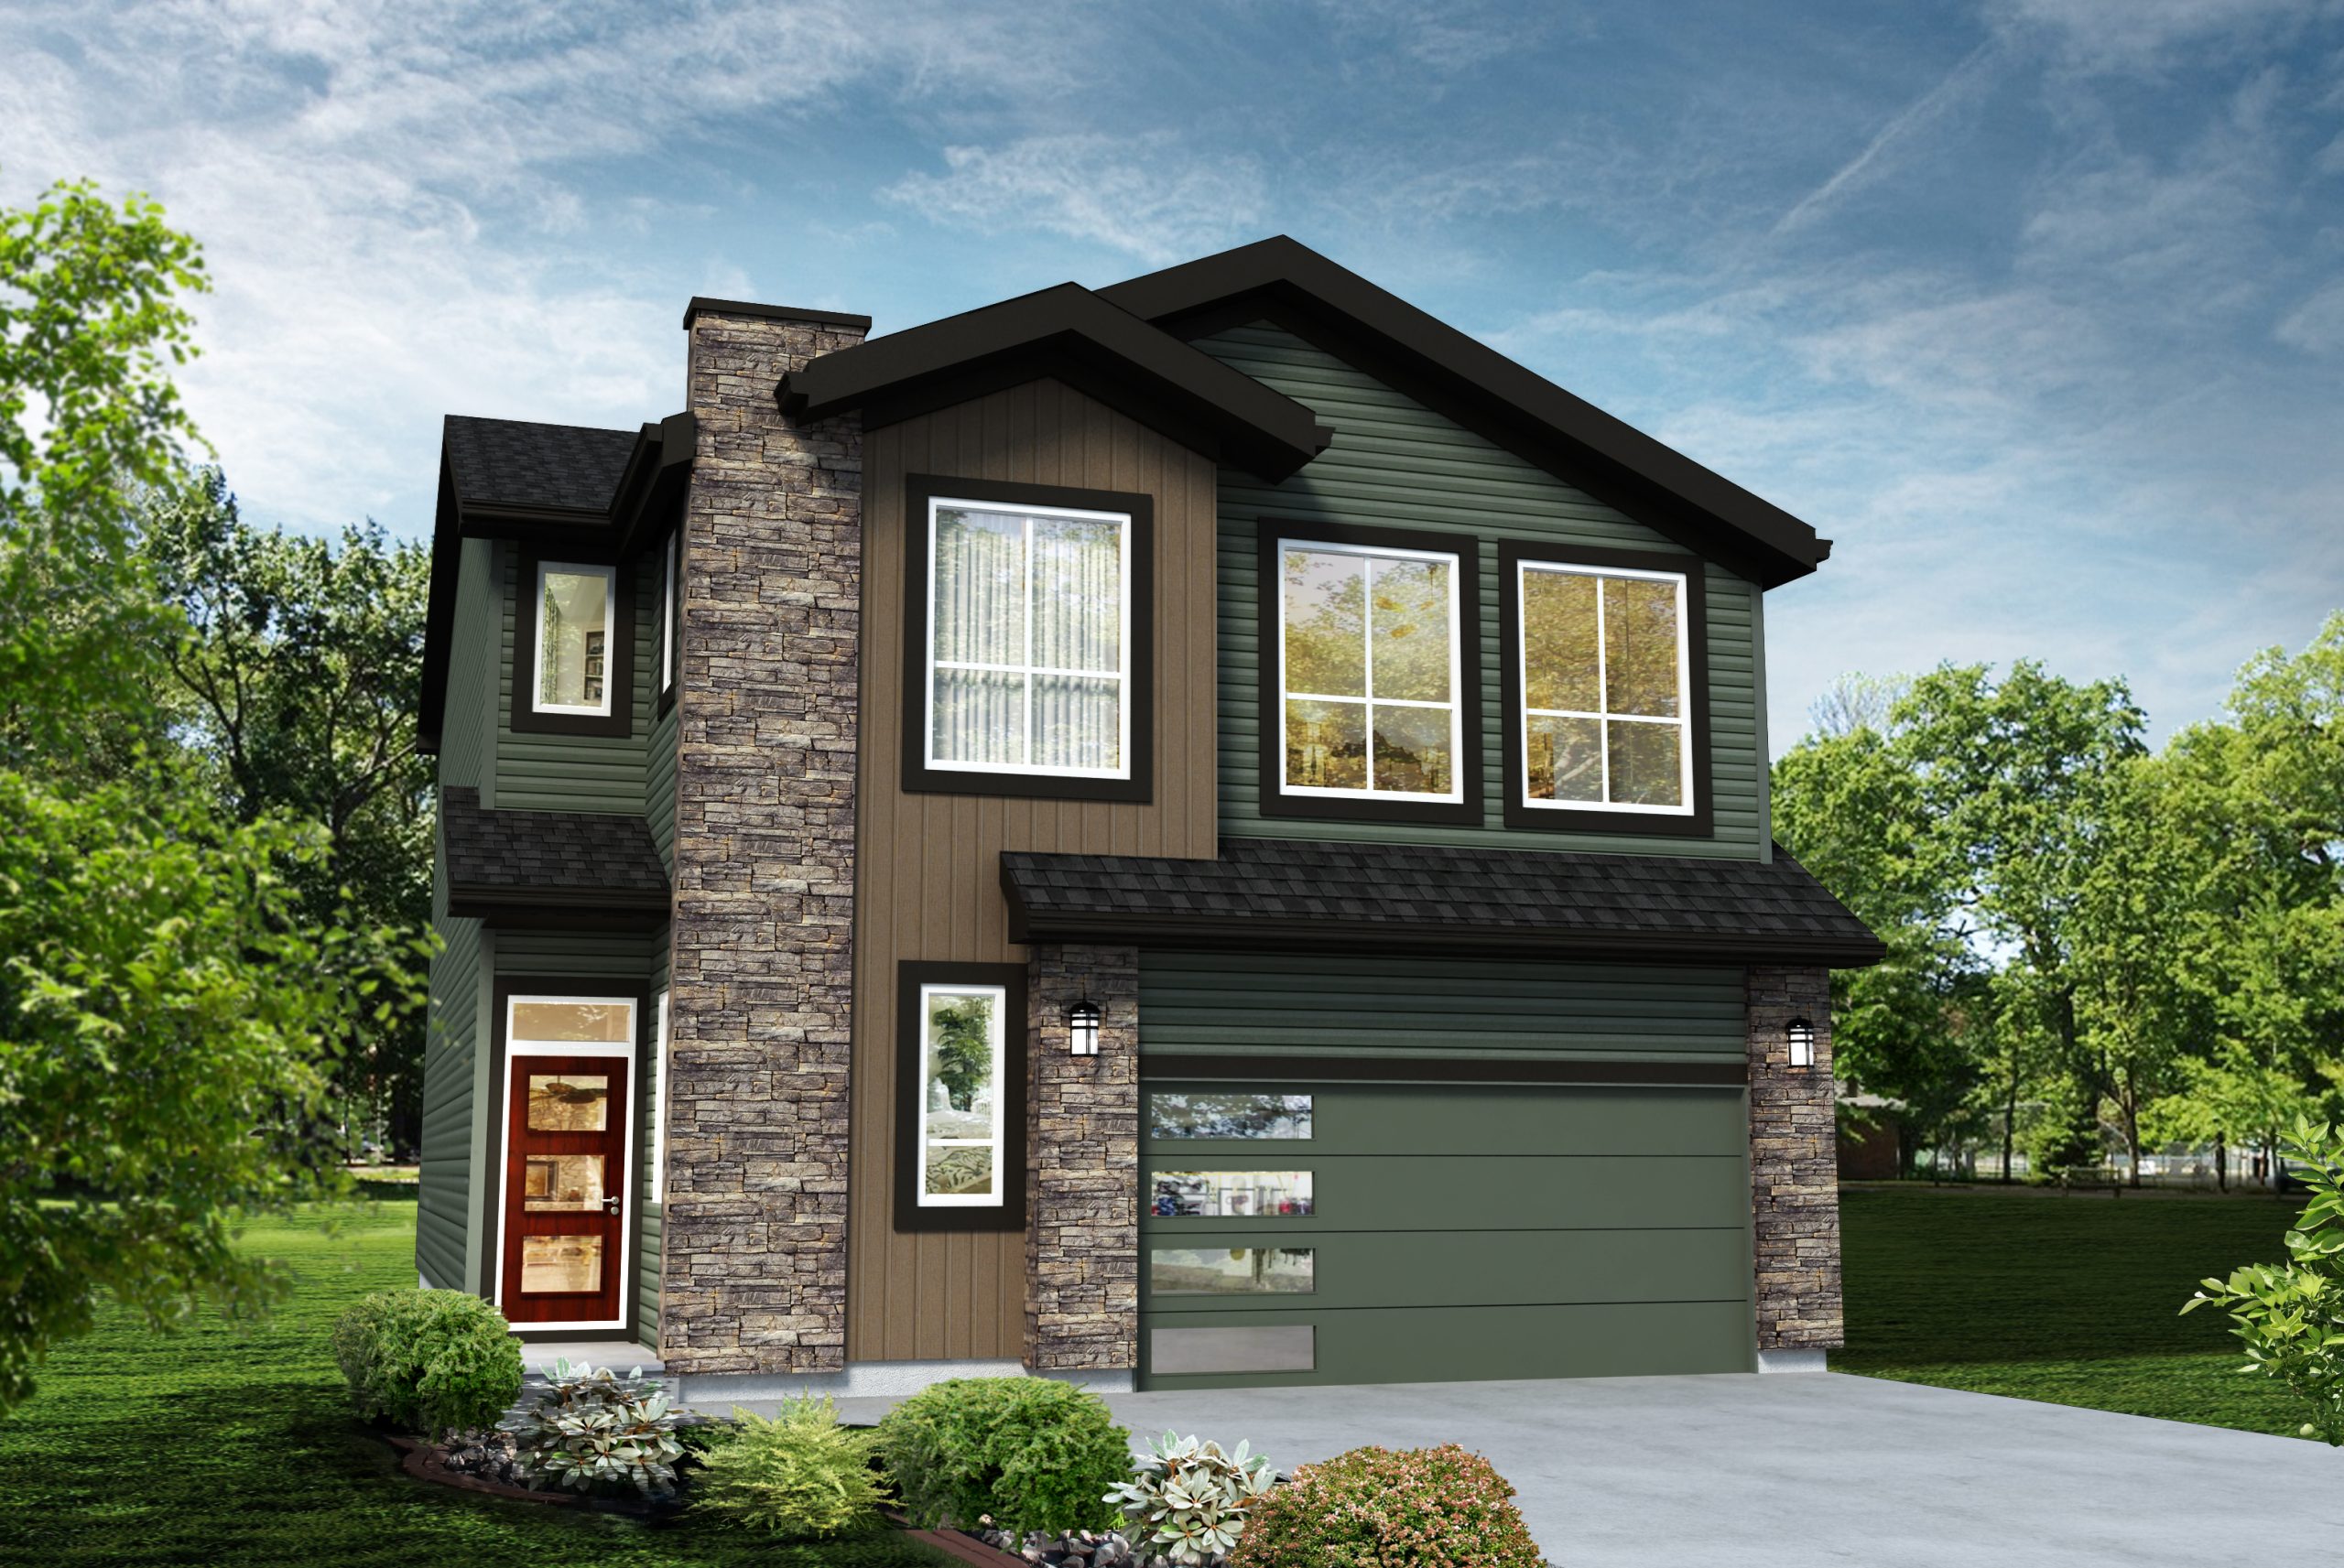
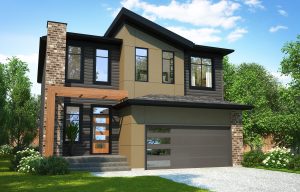
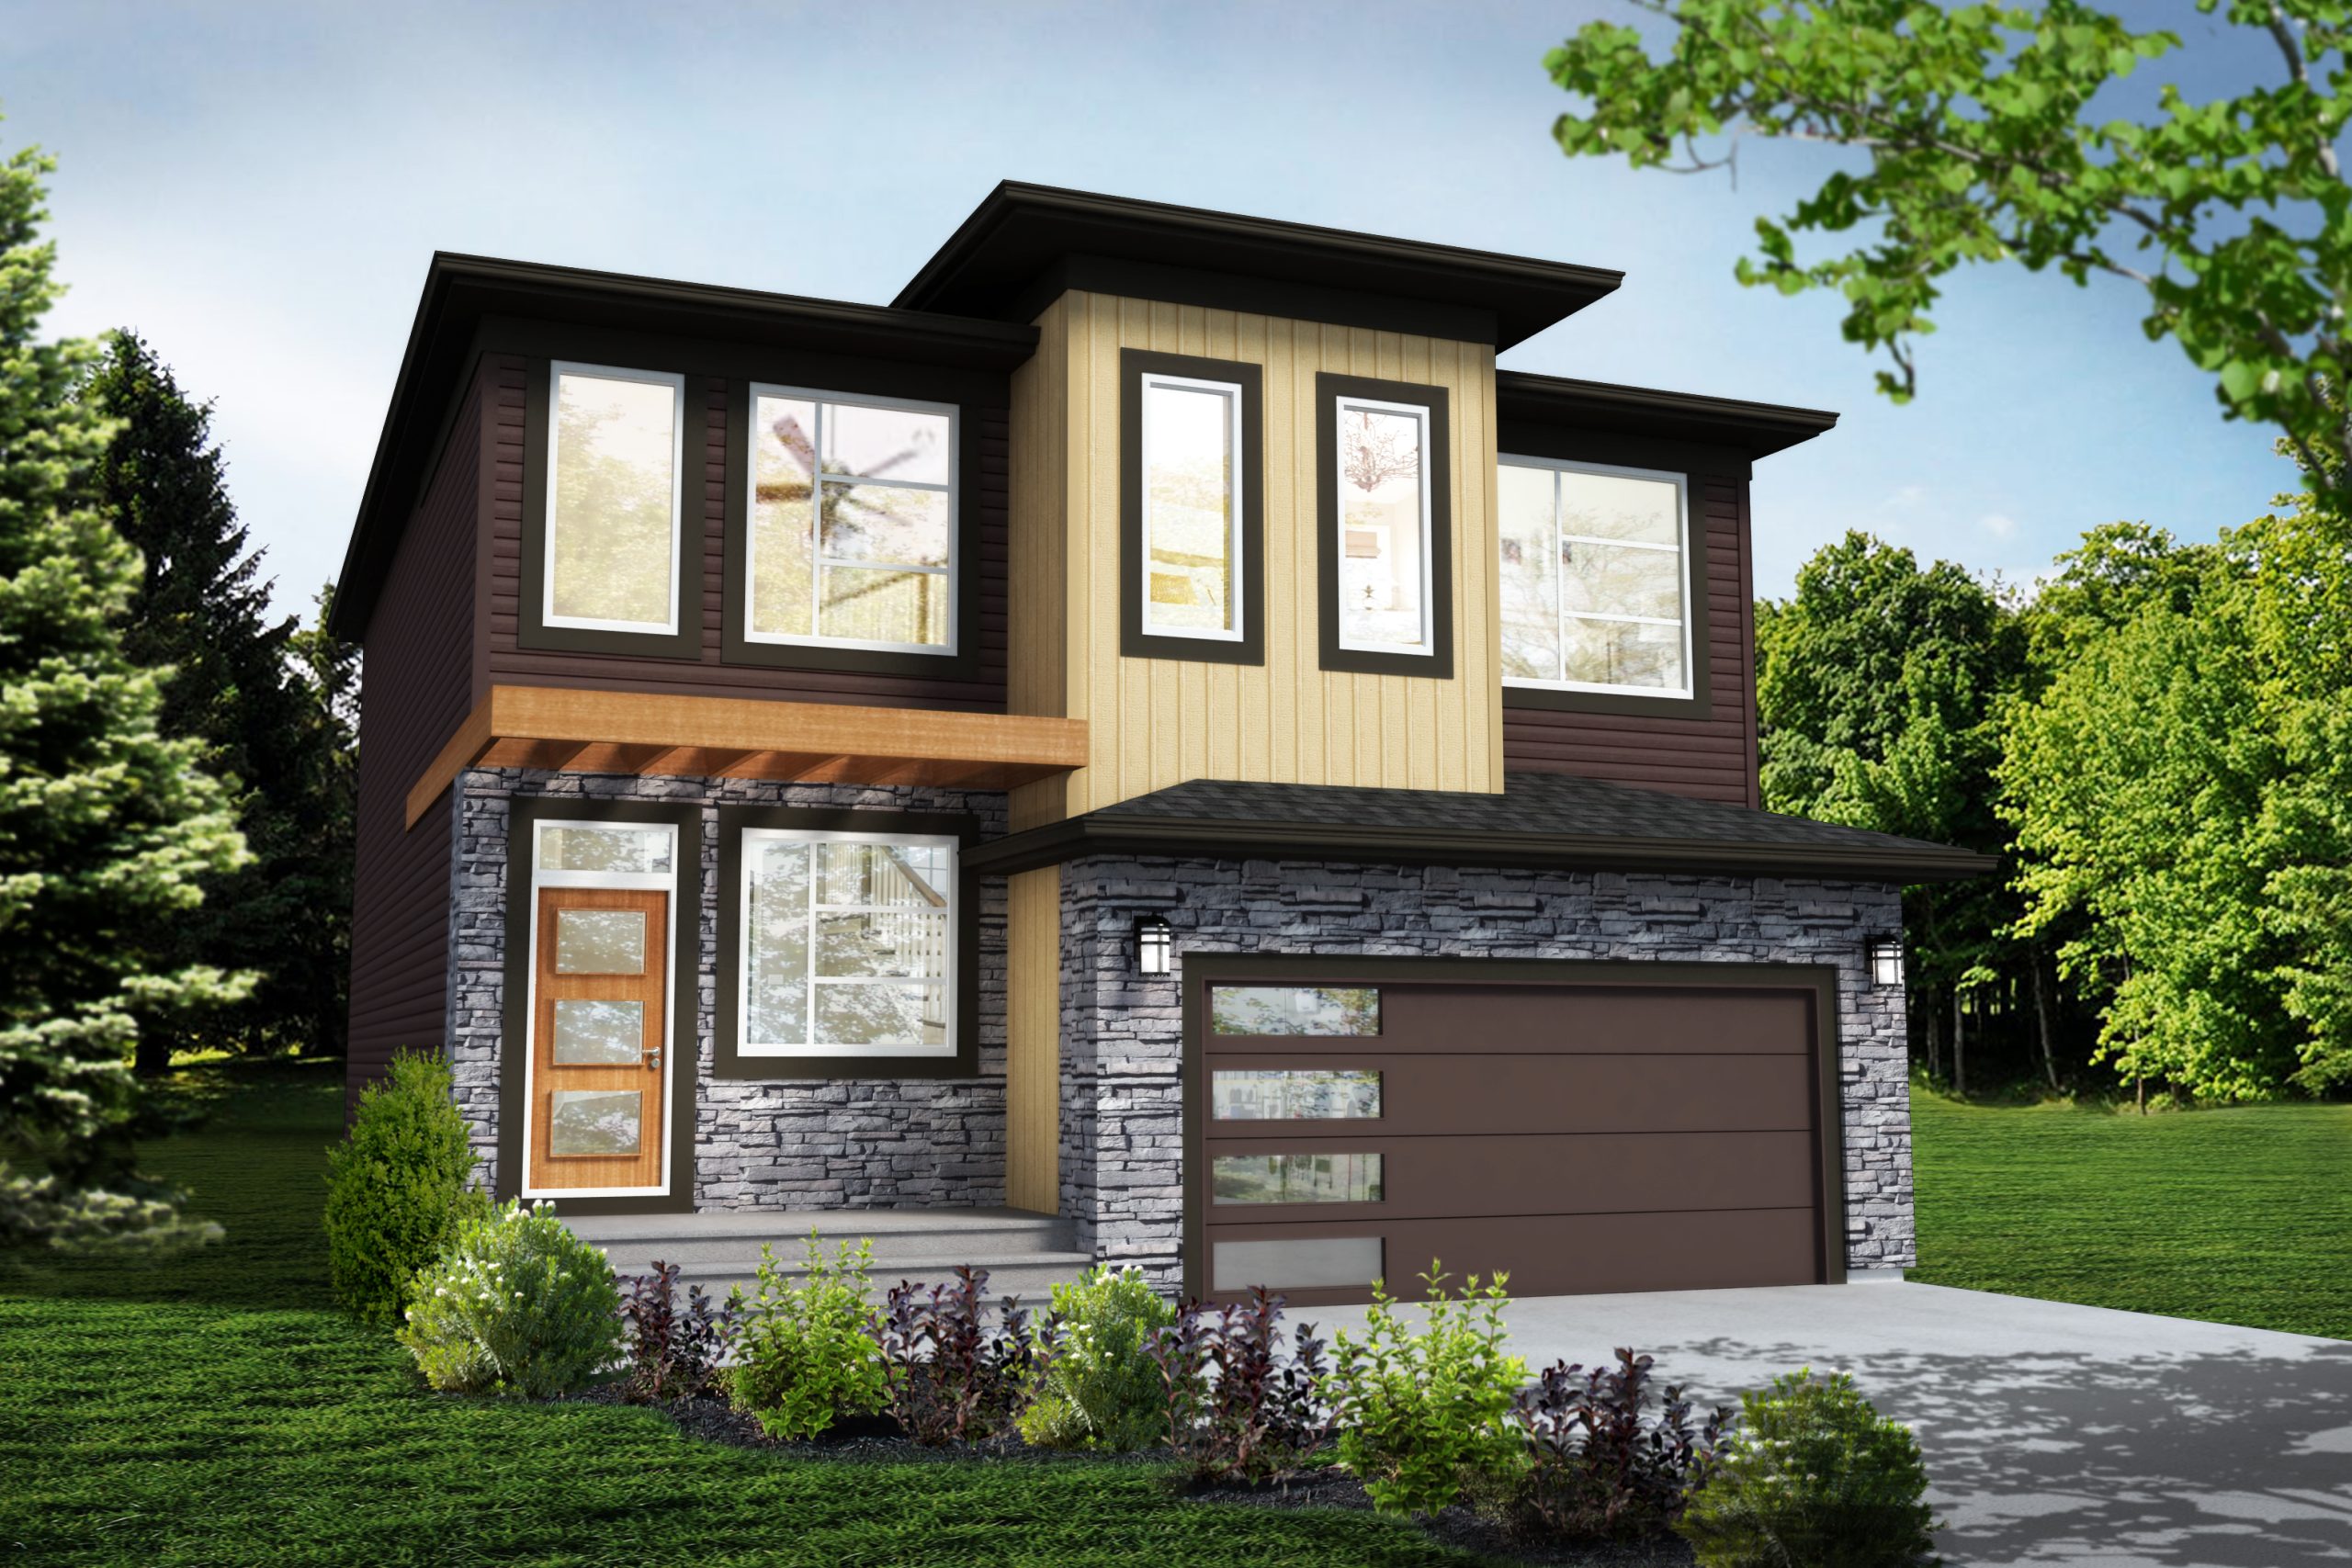
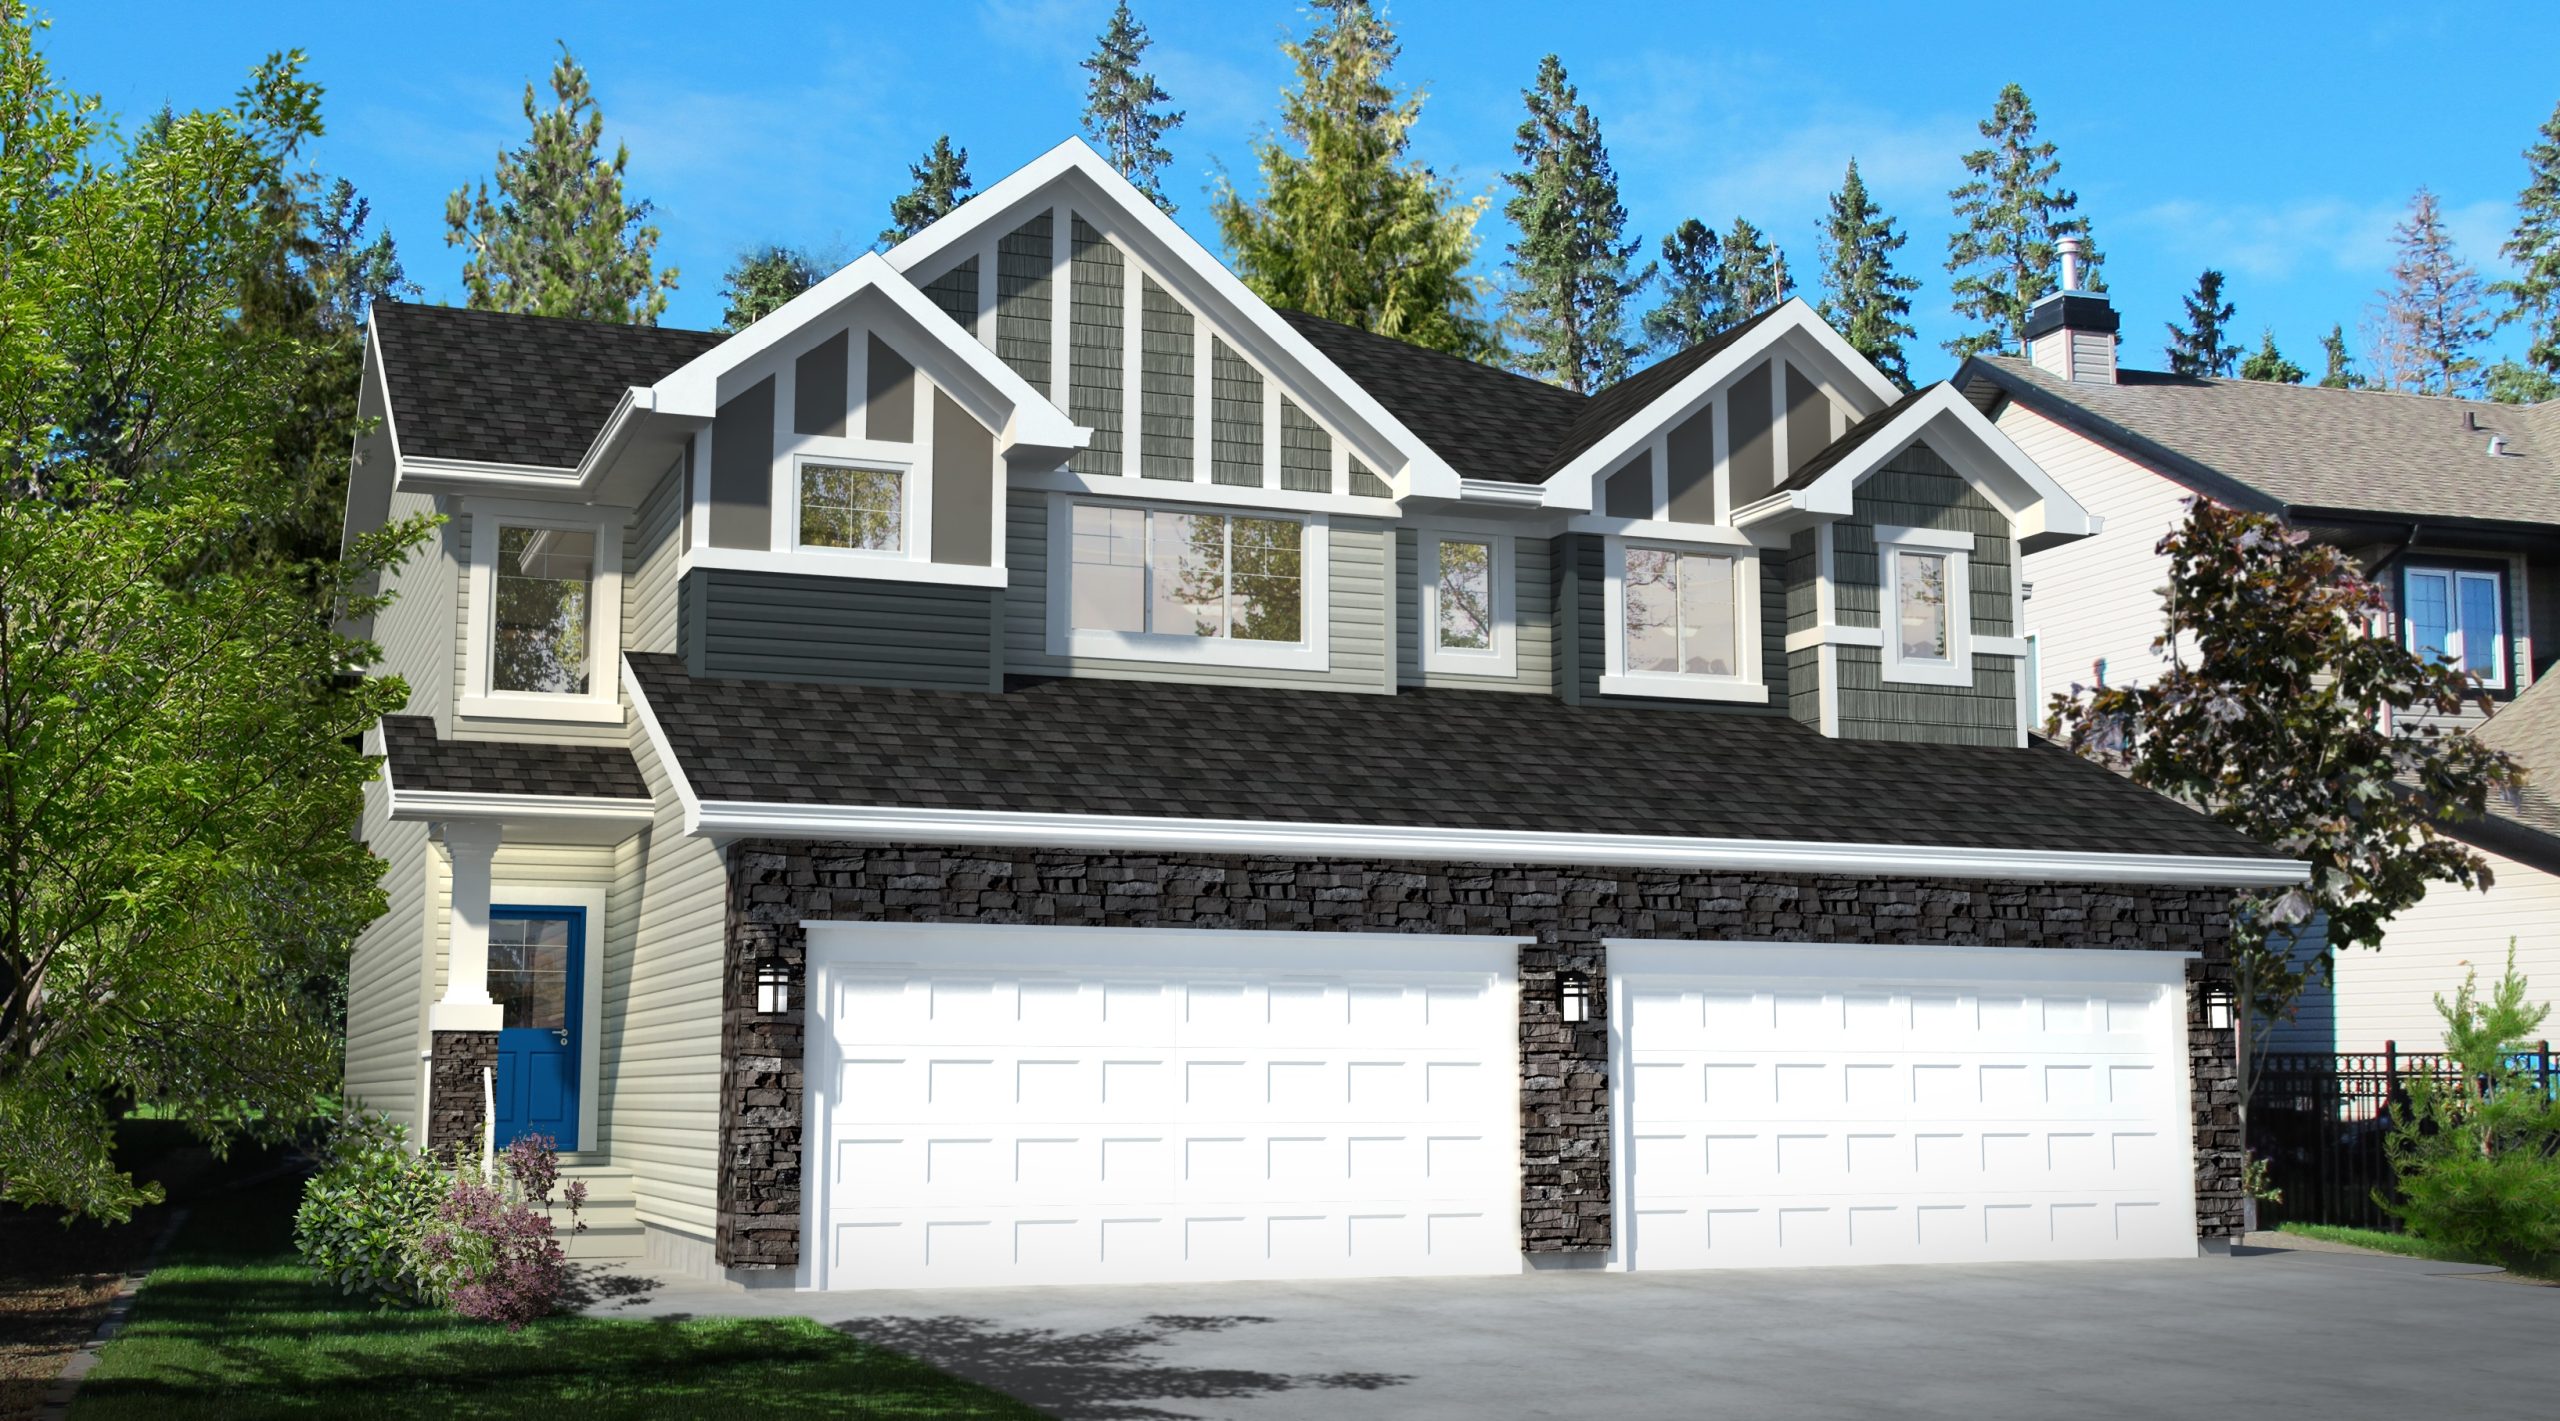
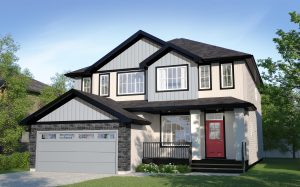
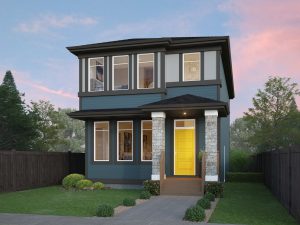
The Lusso Model by Rohit Homes in Edmonton
The Lusso model by Rohit Homes is a modern single-family home designed for buyers who want elevated style, thoughtful space planning, and everyday functionality. With its contemporary exterior, open-concept layout, and access to Rohit Homes’ signature designer interior styles, the Lusso is an excellent choice for families and move-up buyers seeking new construction homes in Edmonton.
Designed with comfort and livability in mind, the Lusso offers a refined take on modern family living without unnecessary complexity.
|
|
 |
 |

Lusso Model Overview
The Lusso model balances clean design with practical living spaces, making it well-suited to a wide range of lifestyles. Its layout prioritizes openness, natural flow, and efficient use of space.
Key features of the Lusso model include:
-
Detached single-family home design
-
Open-concept main living area
-
Functional kitchen, dining, and living spaces
-
Multiple bedroom configuration
-
Designer interior styles included
-
Contemporary exterior elevation
-
Strong long-term livability and resale appeal
The Lusso is ideal for buyers who want a modern home that feels stylish yet comfortable for everyday living.
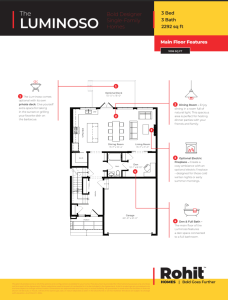
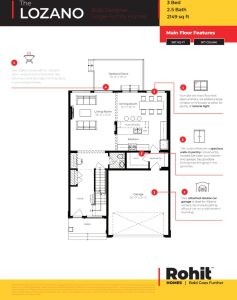
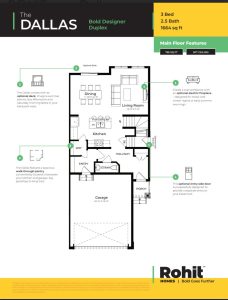
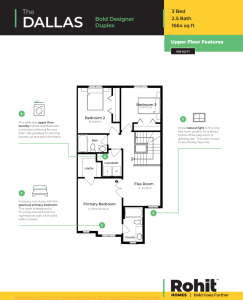
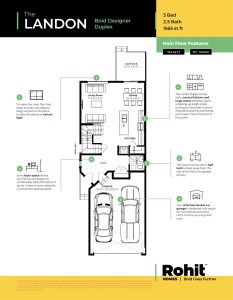
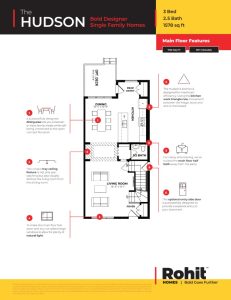
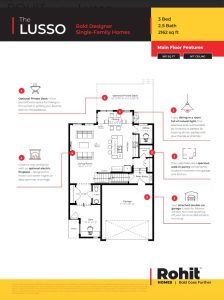
Main Floor Living & Layout
The main floor of the Lusso model is designed to support both daily routines and entertaining. The kitchen anchors the living space and opens seamlessly into the dining and living areas, creating a cohesive and inviting environment.
Thoughtful room placement allows the home to feel open while maintaining clearly defined spaces, making the Lusso practical for busy households and social gatherings alike.
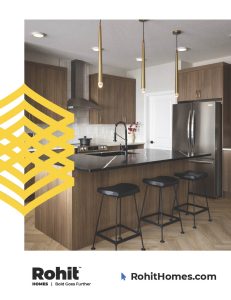
Kitchen & Dining Space
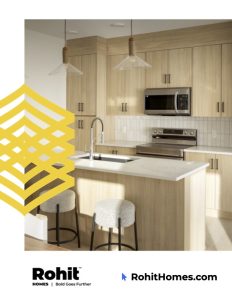
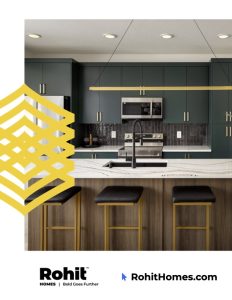
The kitchen in the Lusso model blends modern aesthetics with everyday functionality. Efficient cabinetry, generous counter space, and an intuitive layout make it well-suited for both cooking and hosting.
Depending on the selected interior style, the kitchen can feel sleek and contemporary, bold and refined, or warm and inviting — allowing buyers to personalize the space while maintaining Rohit Homes’ consistent quality standards.
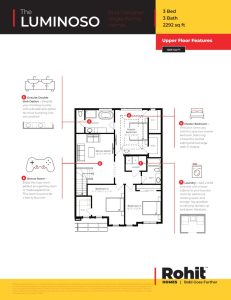
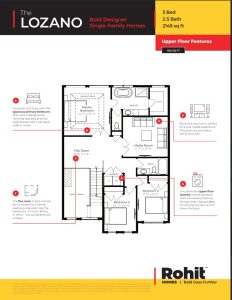
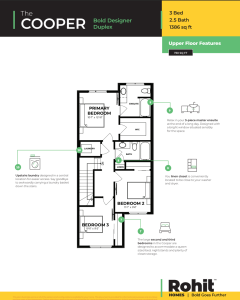
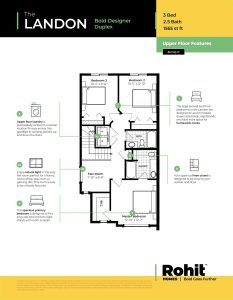
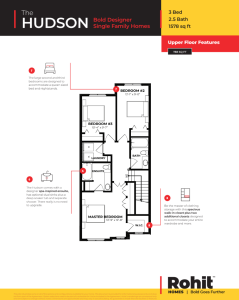
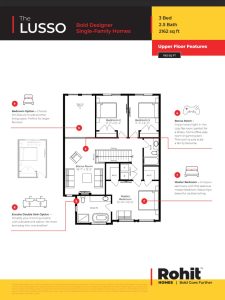
Upper-Level Bedrooms & Comfort
Upstairs, the Lusso model offers well-proportioned bedrooms designed for comfort and privacy. The primary bedroom provides a calm retreat, while additional bedrooms work well for children, guests, or a home office.
This flexible layout allows the Lusso to adapt over time, making it a strong option for long-term homeownership.
Designer Interior Styles: Neo Classical, Haute Contemporary & Ethereal Zen
One of the defining features of the Lusso model is access to Rohit Homes’ curated designer interior styles, which allow buyers to personalize their home without complicated upgrades.
Neo Classical
Neo Classical features clean lines, modern finishes, and a minimalist aesthetic that complements the Lusso’s contemporary layout.
Haute Contemporary
Haute Contemporary delivers a more elevated look with bolder tones and refined details, creating a sophisticated interior with strong visual impact.
Ethereal Zen
Ethereal Zen emphasizes warmth, balance, and natural tones, offering a calm and inviting atmosphere that feels timeless and comfortable.
Each interior style enhances the Lusso while preserving its functional design and modern appeal.
 |
 |
 |