







Stony Plain Real Estate Market Update: October 2026
The Stony Plain real estate market delivered an interesting combination of stronger home prices, faster selling times and increased new listing activity in October 2026 — despite fewer homes actually selling compared with October of last year.
A total of 27 properties sold in Stony Plain during October, down 32.50% from the 40 sales recorded in October 2025. However, the homes that did sell achieved an average sale price of $423,000, representing an 8.06% year-over-year increase.
That price rebound is particularly noteworthy following September's unusually low monthly average of $331,000.
October also brought 45 new listings, an increase of 28.57% from last year, while homes that sold spent an average of only 39 days on market — 20.41% fewer days than October 2025.
Looking at the year as a whole gives us an even clearer picture. Through the end of October, the average Stony Plain sale price is $421,000, up 3.59% from $406,000 during the same period in 2025.
So while fewer properties are changing hands in 2026, Stony Plain home values have remained remarkably resilient.
Let's break down the October 2026 Stony Plain real estate market and what the latest statistics mean for buyers and sellers.
📊 October 2026 Stony Plain Real Estate Market Snapshot
| Metric | October 2026 | Change vs. October 2025 |
| New Listings | 45 | +28.57% |
| Firm Sales | 27 | -32.50% |
| Average Asking Price | $475,000 | +6.70% |
| Average Sale Price | $423,000 | +8.06% |
| Days on Market | 39 days | -20.41% |
| Ask-to-Sell Ratio | 98.7% | +0.51% |
October's statistics present a market with fewer transactions but surprisingly strong performance among the properties that successfully sold.
That distinction is important when assessing the Stony Plain housing market.
🏗️ Stony Plain New Construction Market Trends – October 2026
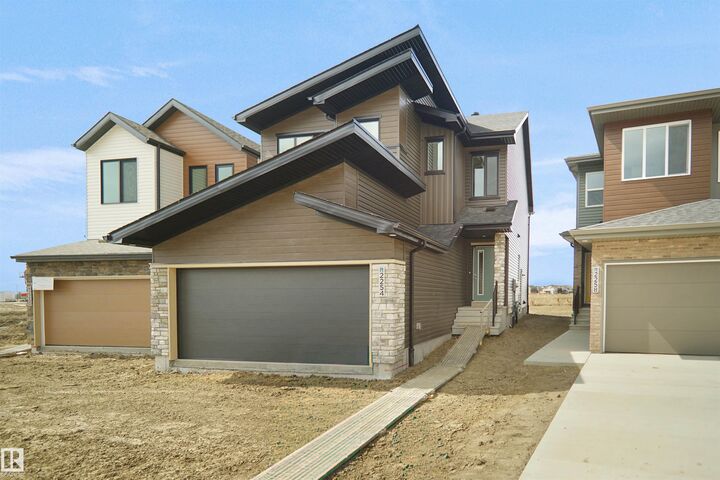
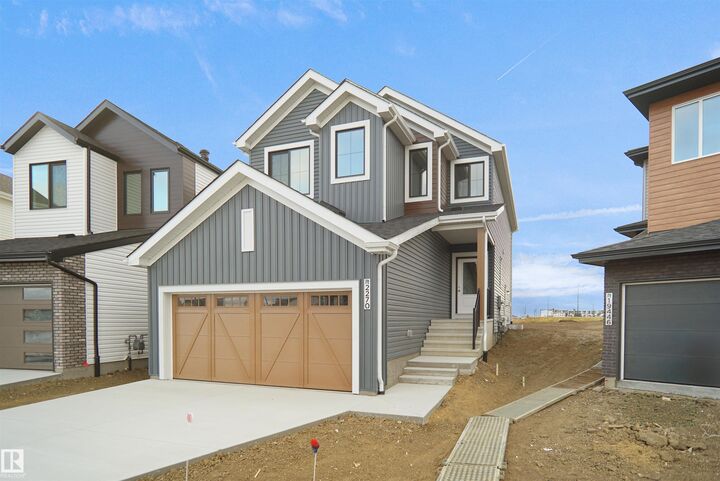
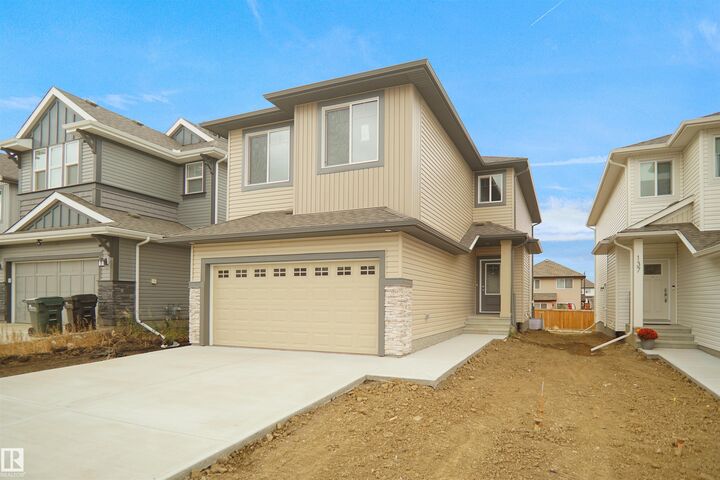
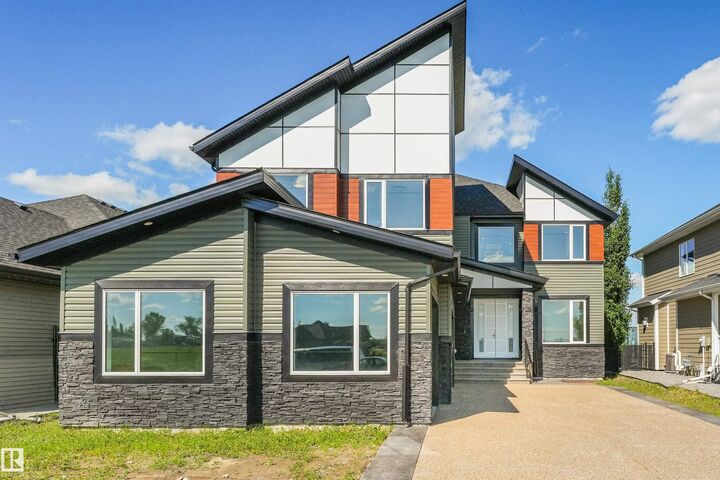
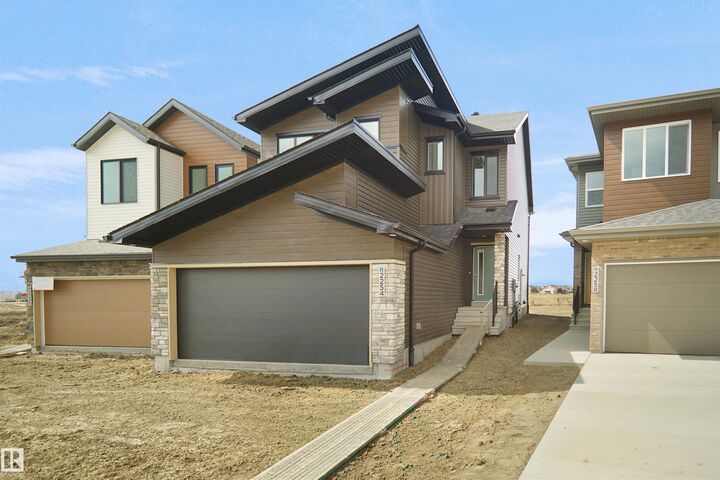
The Stony Plain new construction market remained active in October 2026, with 6 new homes sold, compared with 7 sales in October 2025. While transaction volume was slightly lower year-over-year, new construction homes sold considerably faster, and the median sale price increased significantly.
📊 October New Construction: 2026 vs. 2025
| Metric | October 2026 | October 2025 | Change |
|---|---|---|---|
| New Construction Sales | 6 | 7 | -14.29% |
| Average List Price | $509,252 | $514,679 | -1.05% |
| Average Sale Price | $501,803 | $513,705 | -2.32% |
| Median Sale Price | $526,750 | $471,800 | +11.65% |
| Average Days on Market | 44 days | 65 days | -32.31% |
| Median Days on Market | 45 days | 57 days | -21.05% |
| Highest Sale | $565,000 | $639,900 | -11.70% |
| Lowest Sale | $408,820 | $421,635 | -3.04% |
| Total Sales Volume | $3,010,820 | $3,595,935 | -16.27% |
New Construction Sales Remain Relatively Steady
There were 6 new construction homes sold in Stony Plain during October 2026, compared with 7 in October 2025. That's a relatively modest 14.29% decline in the number of sales.
Total new-construction sales volume reached $3,010,820, compared with $3,595,935 last October. The 16.27% decline in dollar volume reflects both one fewer transaction and a slightly lower average sale price.
Considering the broader Stony Plain market recorded a 32.50% year-over-year decline in firm sales during October, new construction held up relatively well. The overall market recorded 27 firm sales in October 2026, meaning these six new-construction transactions represented a meaningful portion of the month's activity.


Below Graphs Are Interactive
Stony Plain Real Estate - New MLS® Listings
🔹 New Listings Increase 28.57%
October brought another increase in fresh inventory.
There were 45 new listings, up 28.57% compared with October 2025.
Year-to-date, 530 properties have been listed in Stony Plain, compared with 516 through October last year.
That's an increase of 2.71%.
This is particularly important when considered alongside the decline in sales.
October had 45 new listings but only 27 firm sales.
These aren't directly interchangeable measures of inventory — some October listings may sell in November or later, and existing inventory also matters — but the difference does indicate that buyers had a meaningful amount of fresh product entering the market.
For sellers, that means competition matters.
A buyer considering your property may also be comparing it with several similar homes.
Average Asking Price of Homes in Stony Plain
🔹 Average Asking Price Climbs to $475,000
The average asking price reached $475,000 in October, an increase of 6.70% from October 2025.
Year-to-date, the average asking price is now $453,000, compared with $435,000 last year.
That's a 4.27% increase.
Sellers are clearly bringing properties to market at higher price points than they did in 2025.
Importantly, sale prices have also risen on a YTD basis, although not quite as quickly as asking prices.
That reinforces the importance of using recent comparable sales when setting a listing price.
Pricing based solely on what another homeowner is currently asking can be misleading. Active listings tell us the competition; sold listings tell us what buyers have actually been willing to pay.
Stony Plain Home Sales
🔹 Firm Sales Fall 32.50%
A total of 27 properties sold in Stony Plain during October 2026, compared with 40 in October 2025.
That's a substantial 32.50% year-over-year decline.
Through the first ten months of 2026, 362 properties have sold, compared with 405 during the same period in 2025.
That leaves Stony Plain sales 10.62% below last year's pace.
The monthly sales trend also shows the seasonal slowdown clearly. Sales have declined from 44 in July to 35 in August, 28 in September and 27 in October.
That doesn't necessarily mean buyers have disappeared. Fall and winter naturally tend to produce fewer transactions than the spring market.
However, the year-to-date decline confirms that overall sales activity has been softer in 2026 than it was in 2025.
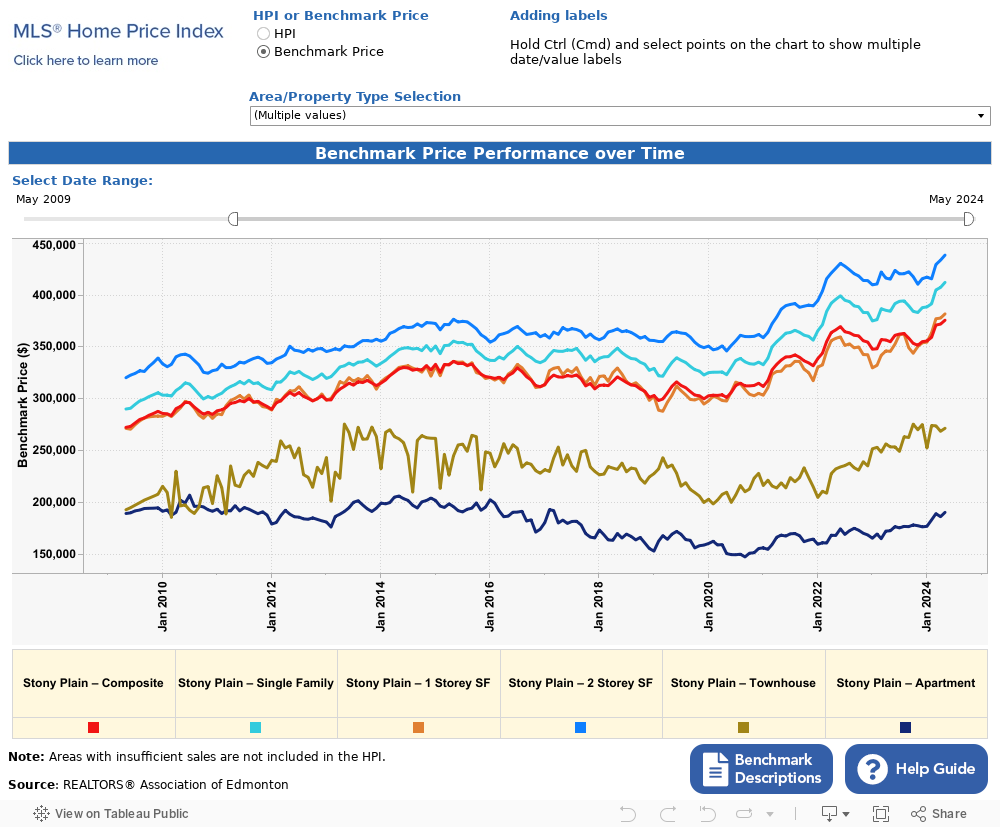
Stony Plain Real Estate Market- Average Home Sale Price
🔹 Average Sale Price Rebounds to $423,000
One of the biggest stories in October is the return of the average sale price to $423,000.
That's 8.06% higher than the $391,000 average recorded in October 2025.
It also represents a substantial rebound from September 2026, when the average fell to just $331,000.
This reinforces something we've discussed throughout these monthly Stony Plain market reports: one month's average price should never be interpreted as the change in value of every home in the community.
September's unusually low average was likely heavily influenced by the mix of properties that happened to sell during the month.
October provides a good example of how quickly that monthly average can move when the composition of sales changes.
The broader year-to-date numbers are much more stable.
Through October, the average sale price is $421,000, compared with $406,000 in 2025.
That's an increase of 3.59%.
For homeowners, that YTD number provides much more useful context than either September's $331,000 average or October's $423,000 average viewed in isolation.
🤝 Ask-to-Sell Ratio Improves to 98.7%
The average ask-to-sell ratio reached 98.7% in October, improving 0.51% from last year.
Year-to-date, the ratio is 98.6%, compared with 99.1% in 2025.
The YTD difference is relatively small, but it tells us buyers have generally had slightly more negotiating room this year.
October's improvement is interesting because it occurred alongside fewer sales.
This suggests the homes that successfully sold were generally priced close enough to market value that buyers and sellers could reach an agreement without substantial discounts.
That's an important lesson for sellers heading into the late fall and winter market.
Stony Plain Average Days on Market
⏱️ Homes Sell Faster in October
One of October's most encouraging statistics is days on market.
Homes that successfully sold took an average of 39 days, down 20.41% from October 2025.
This is a significant improvement.
It also contrasts with the broader year-to-date picture.
Through October, homes have averaged 43.8 days on market in 2026, compared with 37.6 days in 2025 — an increase of 16.49%.
So, once again, the monthly and YTD statistics tell slightly different stories.
Overall, 2026 homes have taken longer to sell than last year.
But October's successful sales actually moved considerably faster than they did in October 2025.
For sellers entering the market now, that's encouraging.
📊 Stony Plain YTD Market Comparison – 2026 vs. 2025
| Metric | 2026 YTD | 2025 YTD | % Change |
| Firm Sales | 362 | 405 | -10.62% |
| New Listings | 530 | 516 | +2.71% |
| Average Asking Price | $453,000 | $435,000 | +4.27% |
| Average Sale Price | $421,000 | $406,000 | +3.59% |
| Days on Market | 43.8 days | 37.6 days | +16.49% |
| Ask-to-Sell Ratio | 98.6% | 99.1% | -0.59% |
The year-to-date numbers provide perhaps the best summary of the Stony Plain real estate market in 2026.
There have been 10.62% fewer sales, while the number of new listings has increased 2.71%.
At the same time, the average sale price is 3.59% higher.
Homes have taken longer to sell overall, and buyers have gained slightly more negotiating room.
That combination points toward a more balanced market than we saw in 2025, rather than a market experiencing a significant decline in property values.
🏘️ What Does the October Market Mean for Stony Plain Buyers?
October's numbers provide some encouraging conditions for buyers.
More homes are entering the market
New listings were up 28.57% compared with last October.
More fresh inventory can mean more choice and more opportunity to compare homes before making a decision.
There are fewer completed transactions
With sales down 32.50%, buyers may face less competition on some properties than they would during the busier spring market.
That can provide more time for inspections, financing and thoughtful decision-making.
Prices remain resilient
Buyers shouldn't assume lower sales activity automatically means falling home values.
October's average sale price was actually 8.06% higher than last year, while the YTD average is up 3.59%.
Some negotiating opportunities remain
The YTD ask-to-sell ratio of 98.6% suggests buyers continue to have some negotiating room, particularly with properties that have spent longer on the market.
🏡 What Does the October Market Mean for Stony Plain Sellers?
For sellers, October offers a mixed but generally encouraging picture.
Prices remain ahead of last year
The monthly average sale price rose 8.06%, and the YTD average remains 3.59% higher.
Successful listings sold faster
The average October sale took only 39 days, significantly faster than last October.
But there are fewer buyers completing purchases
Sales declined by nearly one-third year-over-year.
That means sellers shouldn't assume a higher average price guarantees an easy sale.
Competition is increasing
With new listings up almost 29%, buyers have more homes to compare.
Professional presentation, accurate pricing, strong photography and a comprehensive marketing strategy become even more important in these conditions.
🌳 Why Buyers Continue to Consider Stony Plain
Stony Plain continues to attract buyers looking for a smaller-community lifestyle while remaining connected to the Edmonton metropolitan region.
Its location provides convenient access to Spruce Grove, Parkland County and Edmonton, while the community itself offers a wide variety of housing.
Buyers can find established detached homes, newer developments, townhomes, condos, acreages nearby and new construction.
That range makes Stony Plain appealing to first-time buyers, families, downsizers, move-up purchasers and buyers relocating to the Edmonton area.
New construction also continues to expand the choices available to buyers who prefer modern floor plans, newer building standards and quick-possession opportunities.
🔮 What to Watch in the Stony Plain Market Heading Into Winter
With only two months remaining in 2026, several trends will be particularly important to watch.
Sales activity: YTD transactions are now 10.62% below last year. November and December will determine how large that gap is when the year closes.
Inventory: New listings have now moved 2.71% ahead of last year's pace. We'll want to see whether sellers continue listing into winter or whether supply begins its normal seasonal decline.
Prices: The YTD average remains 3.59% higher despite lower sales activity. Maintaining that increase through year-end would be a meaningful result for homeowners.
Days on market: October's 39-day average was an improvement. It will be interesting to see whether that continues as we enter the traditionally slower winter season.
New construction: Builder activity remains an important component of the Stony Plain market and will continue to be tracked separately.
📌 October 2026 Stony Plain Market: The Bottom Line
October's numbers demonstrate why sales volume and home values need to be evaluated separately.
Only 27 homes sold, down 32.50% from October 2025, yet the average sale price climbed to $423,000 — an 8.06% increase.
Meanwhile, 45 new listings entered the market, homes that sold took just 39 days on average, and sellers achieved approximately 98.7% of their asking price.
Year-to-date, the picture is equally interesting.
Stony Plain has experienced 10.62% fewer sales, but the average sale price remains 3.59% higher than in 2025.
For buyers, the combination of additional inventory and lower sales activity may create opportunities.
For sellers, higher values remain encouraging, but fewer transactions and greater competition make pricing, presentation and marketing strategy increasingly important.
And for anyone trying to determine what a specific Stony Plain home is worth, citywide averages are only the beginning.
📞 Thinking About Buying or Selling in Stony Plain?
If you're considering buying, selling or exploring new construction homes in Stony Plain, understanding what's happening within your specific price range and property type is far more useful than relying on a single market-wide average.
I'm Chris Reid, REALTOR® with Century 21 Leading, helping buyers and sellers throughout Stony Plain, Spruce Grove, Parkland County and the greater Edmonton area.
Call or text: (780) 717-5267
Email: creid@chrisreidedmonton.com
Website: chrisreidedmonton.com
Whether you'd like to know what your Stony Plain home could sell for in today's market, compare neighbourhoods or explore new construction opportunities, I can help you build a strategy based on current local market data.

CENTURY 21 Leading
INFO & SERVICES
CENTURY 21 Leading
14315 118 Ave NW, Unit 130, Edmonton, AB T5L4S6
(780) 455-0777
INFO & SERVICES
Independently Owned and Operated. ®/™ trademarks owned by Century 21 Real Estate LLC used under license or authorized sub-license. © 2020 Century 21 Canada Limited Partnership © 2020 Century 21 Canada Limited Partnership
The trademarks MLS®, Multiple Listing Service® and the associated logos identify professional services rendered by REALTOR® members of CREA to effect the purchase, sale and lease of real estate as part of a cooperative selling system. The trademarks REALTOR ® , REALTORS ® and the REALTOR ® logo are controlled by The Canadian Real Estate Association (CREA) and identify real estate professionals who are members of CREA. Used under license. This listing content provided by REALTOR.ca has been licensed by REALTOR® members of The Canadian Real Estate Association. Not intended to solicit properties currently listed for sale or buyers under contract.
Century 21 Canada Limited Partnership currently has franchise opportunities available in select markets across Canada. The intent of this communication is for informational purposes only and is not intended to be a solicitation to anyone under contract with another real estate brokerage operation. This e-mail message contains confidential information intended only for the use of the individual or entity named above. Any unauthorized use or disclosure is strictly prohibited. If you have received this communication in error please immediately delete the e-mail and either notify the sender at the above e-mail address or by telephone.
© 2026 MoxiWorks
