























Beaumont Real Estate Market Update: July 2026 Statistics
The Beaumont real estate market moved through the heart of the summer season with a mix of stability and shifting market conditions in July 2026. Sales activity was slightly lower than it was last July, while the number of new listings remained unchanged for the month. At the same time, homes took considerably longer to sell and buyers continued to negotiate below asking price.
Looking at the bigger picture, however, Beaumont's market remains remarkably steady. Year-to-date sales are almost identical to 2025, while both average asking prices and average sale prices remain higher. The biggest change is on the supply side: substantially more properties have been listed for sale so far this year, providing buyers with more selection and creating greater competition among sellers.
For anyone considering buying a home in Beaumont, selling a Beaumont property, or exploring new construction, July's statistics provide some important clues about where the market may be heading as we move toward fall.
📊 Beaumont July 2026 Market Snapshot
| Metric | July 2026 | July 2025 | % Change |
| Sold Properties | 46 | 48 | ↓ 4.17% |
| New Listings | 106 | 106 | 0.00% |
| Average Asking Price | $610,000 | Approx. $575,000 | ↑ 6.16% |
| Average Sale Price | $546,000 | Approx. $574,000 | ↓ 4.81% |
| Days on Market | 71 | Approx. 52 | ↑ 36.54% |
| Ask-to-Sell Ratio | 98.2% | Approx. 98.7% | ↓ 0.51% |
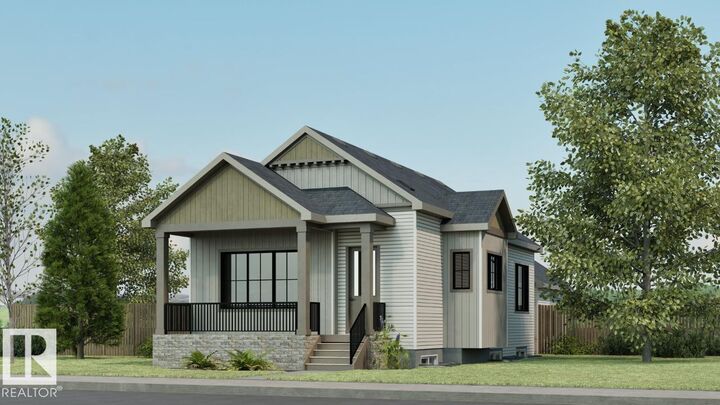
🏗️ Beaumont New Construction Market – July 2026 vs. July 2025
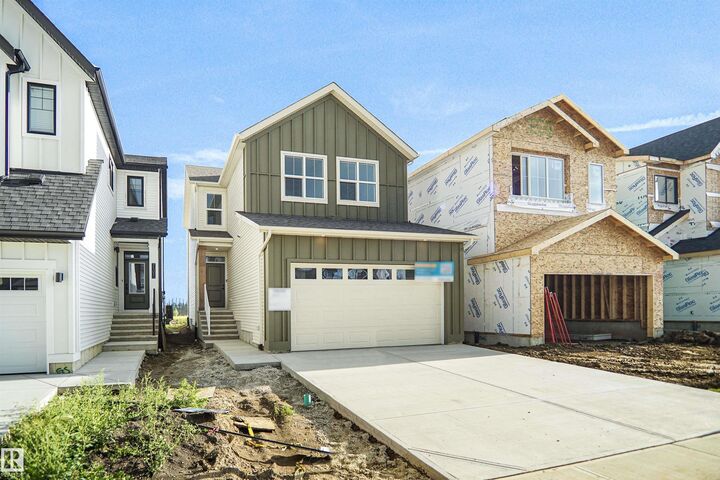
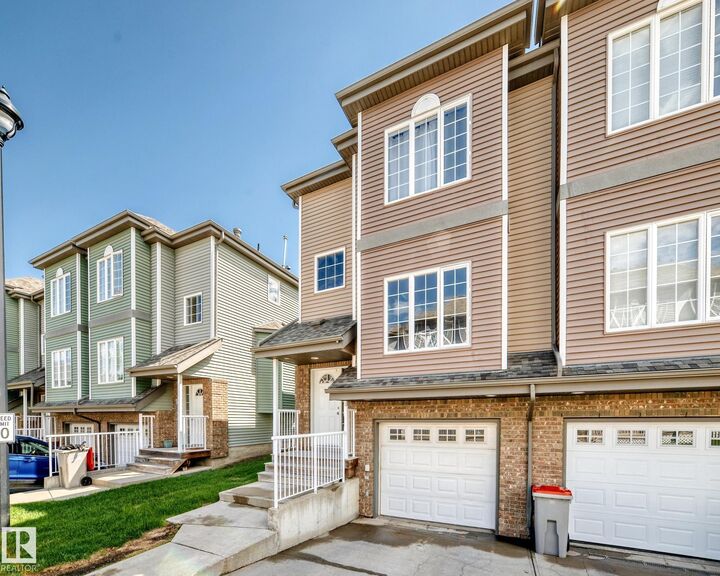
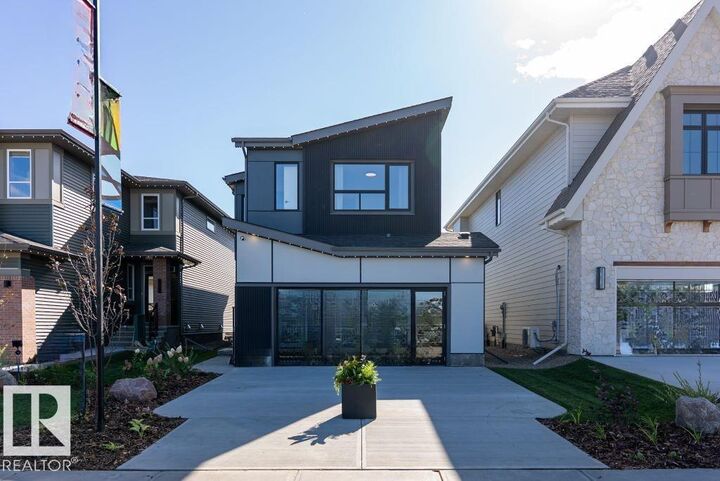
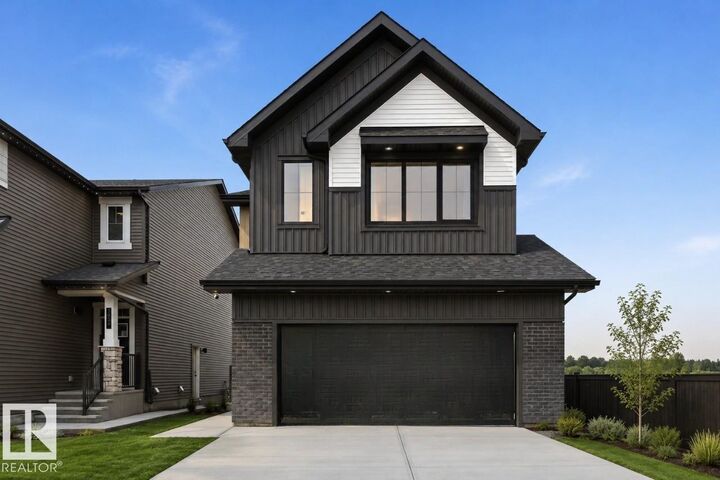
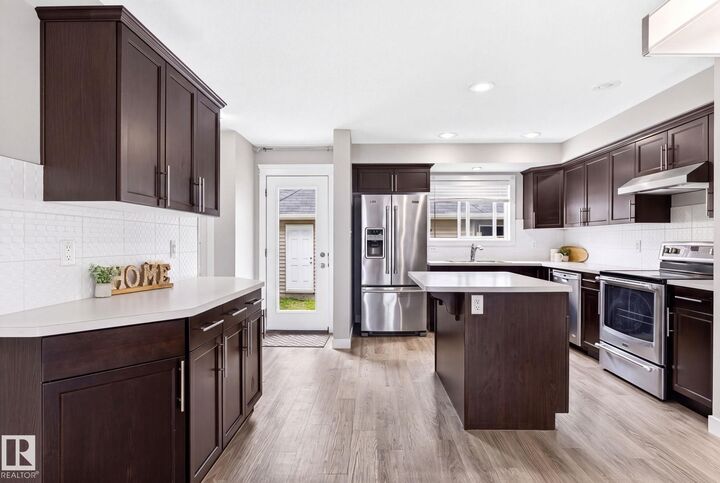
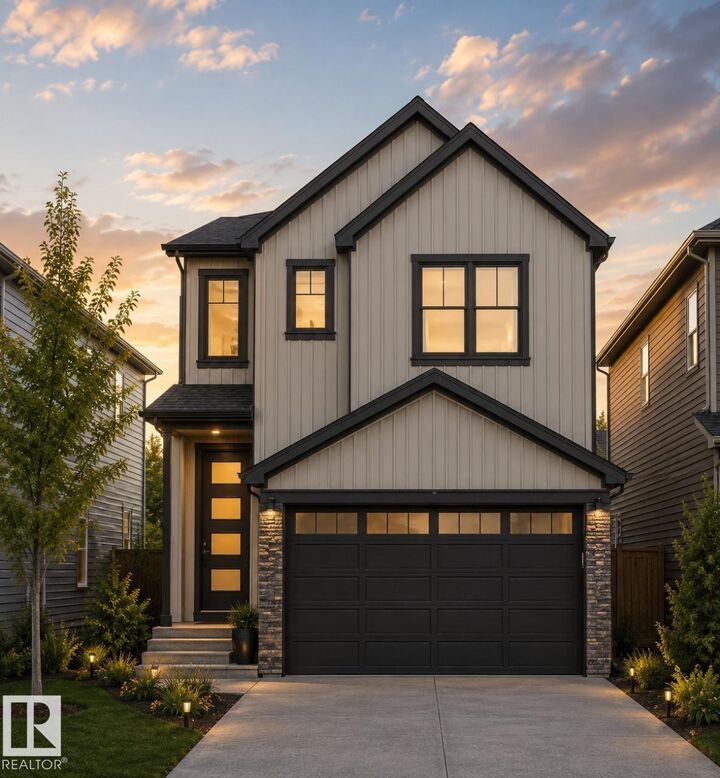
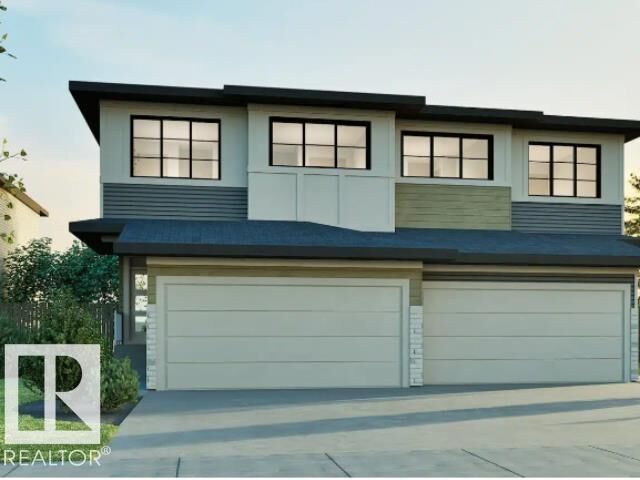
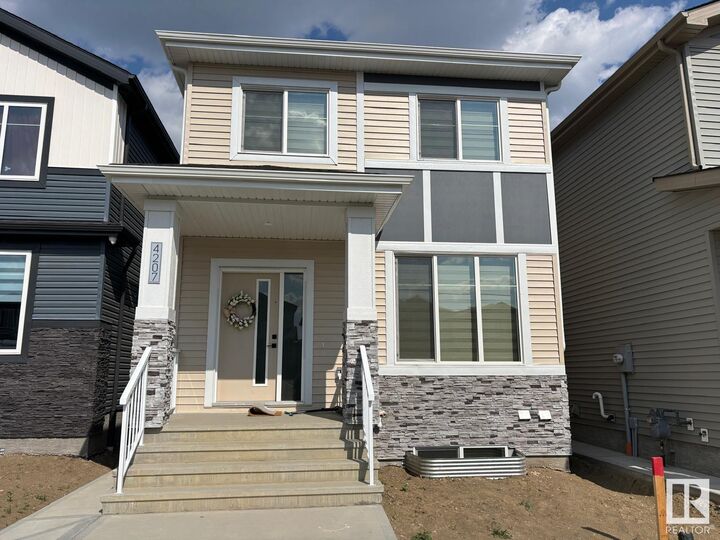
New construction activity in Beaumont increased substantially in July 2026. There were 11 new construction sales, compared with only 5 in July 2025, representing a 120% increase in the number of new homes sold. At the same time, the type and price point of new homes being purchased changed considerably. Buyers gravitated toward more affordable new construction in 2026, while selling times increased. New builds sold in an average of 91 days, compared with 65 days in July 2025, while the median increased from 56 to 83 days.
| Metric | July 2026 | July 2025 | Change |
|---|---|---|---|
| New Construction Sales | 11 | 5 | ↑ 120.0% |
| Average Days on Market | 91 | 65 | ↑ 40.0% |
| Median Days on Market | 83 | 56 | ↑ 48.2% |
| Average List Price | $508,118 | $620,938 | ↓ 18.2% |
| Median List Price | $459,800 | $659,900 | ↓ 30.3% |
| Average Sale Price | $495,358 | $607,300 | ↓ 18.4% |
| Median Sale Price | $448,350 | $645,000 | ↓ 30.5% |
| Highest Sale Price | $602,000 | $704,000 | ↓ 14.5% |
| Lowest Sale Price | $379,900 | $509,500 | ↓ 25.4% |
| Total Sold Value | $5,448,945 | $3,036,500 | ↑ 79.4% |


Interactive bar graphs
Beaumont New MLS® Listings
🏘️ New Listings Hold Steady in July
There were 106 new listings in Beaumont during July 2026, exactly the same number recorded in July 2025.
On the surface, that suggests very little change. The year-to-date numbers tell a different story.
Through July, 628 properties have been listed in Beaumont, compared with 536 during the same period last year. That's an increase of 17.16%.
This is one of the most important statistics in this month's report.
Sales are essentially unchanged year-to-date, but significantly more homes have entered the market.
That means buyers have considerably more choice than they did a year ago, and sellers are competing against a larger pool of available properties.
For buyers, increased selection can make the purchasing process less stressful. Instead of feeling pressured to write an offer immediately, there may be an opportunity to compare several properties, evaluate value carefully and negotiate.
For sellers, however, this makes pricing and presentation increasingly important. Buyers don't necessarily have to compromise when another comparable property may be available just down the street.
Average Asking Price
💰 Average Asking Price in Beaumont
The average asking price in Beaumont reached $610,000 in July 2026, representing a 6.16% increase compared with July 2025.
The year-to-date trend is also positive. Through the first seven months of 2026, the average asking price is $609,000, compared with $587,000 during the same period in 2025. That's an increase of 3.76%.
These numbers show that seller expectations remain strong despite the substantial increase in listing activity.
However, asking price needs to be considered alongside the other market indicators. Homes are taking longer to sell, buyers have more properties to choose from, and the ask-to-sell ratio has declined slightly.
In this type of market, sellers need to be careful not to interpret rising average asking prices as permission to overprice.
A home's value is ultimately determined by what today's buyers are prepared to pay. A property that enters the market too high can lose valuable early exposure and may eventually require price reductions to generate renewed interest.
Beaumont Home Sales
🏡 46 Homes Sold in Beaumont in July
There were 46 properties sold in Beaumont during July 2026, a 4.17% decrease compared with July 2025, when 48 homes sold.
A two-sale difference is relatively small and doesn't indicate a dramatic decline in demand. In fact, the year-to-date numbers demonstrate just how stable sales activity has been.
Through the end of July, 277 properties have sold in Beaumont in 2026, compared with 276 during the same period in 2025. That's an increase of just 0.36%.
The monthly sales chart in the July report also provides some useful context. Sales increased from 27 in February to 32 in March, 51 in April and 53 in May. June recorded 47 sales, followed by 46 in July.
What we're seeing is a fairly typical moderation after the busiest part of the spring market rather than a dramatic pullback in buyer activity.
For sellers, there are still buyers in the market. The challenge is that those buyers now have considerably more properties competing for their attention.
Average Sale Price
🏡 Average Sale Price in Beaumont
The average sale price was $546,000 in July 2026, representing a 4.81% decrease compared with July 2025.
A monthly decline should always be viewed in context. Average prices can move considerably from one month to another depending on the types and price ranges of properties that happen to sell.
The longer-term numbers are therefore particularly useful.
Year-to-date, the average Beaumont sale price is $551,000, compared with $544,000 during the same period in 2025. That represents a 1.26% increase.
So, while July's average sale price was lower than last July, Beaumont home values remain slightly ahead of last year when we look at the first seven months as a whole.
The monthly sales-price graph on the report also shows prices remaining relatively stable through 2026 after some much larger fluctuations in late 2024 and early 2025.
For homeowners, that distinction matters. One softer month does not necessarily indicate declining property values, particularly when the year-to-date average remains positive.
🤝 Average Ask-to-Sell Ratio
Homes sold for an average of 98.2% of asking price in July, representing a slight decline from the previous year.
Year-to-date, Beaumont's ask-to-sell ratio sits at 98.4%, compared with 99.3% during the same period in 2025.
This indicates that negotiation has become a more normal part of the transaction.
For buyers, that may mean opportunities to negotiate on price or other terms, particularly when a home has been available for an extended period.
For sellers, it reinforces the importance of starting with a realistic asking price. Listing significantly above market value with the expectation that a buyer will simply negotiate downward can make the property appear less competitive against correctly priced alternatives.
Average Days on Market
⏳ Days on Market Rise to 71
One of July's most noticeable changes was the amount of time it took properties to sell.
The average days on market reached 71 days, an increase of 36.54% compared with July 2025.
Year-to-date, the difference is even larger.
Homes sold in Beaumont have averaged 75 days on market in 2026, compared with 45 days during the same period in 2025 — an increase of 66.67%.
This is an important shift for sellers.
It doesn't mean homes aren't selling. Year-to-date sales are actually slightly higher than last year. Instead, it suggests buyers are taking more time to make purchasing decisions.
With more inventory available, buyers can compare properties, revisit homes, investigate neighbourhoods and negotiate before committing.
Sellers should therefore be prepared for a potentially longer marketing period and avoid assuming that a property has failed simply because it hasn't sold within the first week or two.
At the same time, a lack of showings or buyer interest can be an important signal that price, condition or marketing needs to be reconsidered.
📊 Beaumont Year-to-Date Comparison: 2026 vs. 2025
| Metric | 2026 YTD | 2025 YTD | % Change |
| Sold Properties | 277 | 276 | ↑ 0.36% |
| New Listings | 628 | 536 | ↑ 17.16% |
| Average Asking Price | $609,000 | $587,000 | ↑ 3.76% |
| Average Sale Price | $551,000 | $544,000 | ↑ 1.26% |
| Days on Market | 75 | 45 | ↑ 66.67% |
| Ask-to-Sell Ratio | 98.4% | 99.3% | ↓ 0.91% |
What Do the Beaumont YTD Numbers Tell Us?
The year-to-date comparison provides perhaps the clearest picture of the Beaumont housing market in 2026.
Sales are virtually identical to last year — 277 versus 276 — which indicates that overall buyer demand has remained remarkably stable.
At the same time, the number of new listings has increased by more than 17%.
That's an important combination.
It suggests Beaumont hasn't experienced a significant loss of buyer demand; instead, buyers simply have substantially more inventory competing for that demand.
Despite this additional supply, average prices have held up well. The average asking price is 3.76% higher year-to-date, while the average selling price is 1.26% higher.
The most significant change has been the length of time required to sell a home, with average days on market increasing from 45 to 75.
Taken together, these statistics point toward a more balanced and competitive market than Beaumont experienced a year ago.
🧠 What July's Market Means for Beaumont Buyers
For buyers, current market conditions provide something that was often missing during faster markets: choice and time.
With year-to-date listings up 17.16%, buyers can potentially compare more properties before making a decision.
Longer selling times and a 98.2% monthly ask-to-sell ratio also suggest that there may be room for negotiation depending on the individual property.
That doesn't mean every seller will negotiate or that every desirable home will sit on the market. A well-priced home in excellent condition can still attract attention quickly.
Buyers should have financing in place, understand recent comparable sales and be prepared to act when the right property appears.
💼 What July's Market Means for Beaumont Sellers
The July statistics aren't bad news for sellers — but they do emphasize the importance of strategy.
Year-to-date sales are slightly higher than last year and average sale prices remain positive. There are clearly buyers in the Beaumont market.
The challenge is competition.
With 628 new listings already recorded this year, buyers have more choices. A seller needs to give them a compelling reason to choose their property.
Professional photography, accurate pricing, strong online marketing, thoughtful presentation and a clear understanding of competing inventory all matter.
Price is particularly important. The first few weeks on the market often provide the strongest opportunity to capture buyer attention. Starting too high can result in the property accumulating days on market while newer competing listings continue to appear.
🔮 Beaumont Real Estate Outlook for Late Summer and Fall 2026
As Beaumont moves toward the late-summer and fall market, inventory will be one of the most important trends to watch.
If listings continue to outpace sales, buyers could gain additional leverage. That would put further pressure on sellers to compete on price, condition and presentation.
At the same time, year-to-date pricing remains resilient. The average sale price is still 1.26% higher than last year, despite the increase in available inventory.
That makes the next few months particularly interesting.
Rather than a market experiencing a dramatic rise or decline, Beaumont appears to be moving toward greater balance.
For buyers, that can mean more selection and negotiating opportunities.
For sellers, it means success is increasingly determined by how well a property is positioned against its competition.
📞 Thinking About Buying or Selling a Home in Beaumont?
Market-wide averages are useful for understanding the direction of Beaumont real estate, but they don't tell you exactly what an individual home is worth.
Neighbourhood, property type, age, lot size, upgrades, condition, garage configuration and competing inventory can all have a significant impact on value.
Data provided by the REALTORS® Association of Edmonton and subject to change. Always consult with a real estate professional for the most current market information.
If you would like more information on the Beaumont real estate market contact Chris Reid
Beaumont Website

CENTURY 21 Leading
INFO & SERVICES
CENTURY 21 Leading
14315 118 Ave NW, Unit 130, Edmonton, AB T5L4S6
(780) 455-0777
INFO & SERVICES

Independently Owned and Operated. ®/™ trademarks owned by Century 21 Real Estate LLC used under license or authorized sub-license. © 2020 Century 21 Canada Limited Partnership © 2020 Century 21 Canada Limited Partnership
The trademarks MLS®, Multiple Listing Service® and the associated logos identify professional services rendered by REALTOR® members of CREA to effect the purchase, sale and lease of real estate as part of a cooperative selling system. The trademarks REALTOR ® , REALTORS ® and the REALTOR ® logo are controlled by The Canadian Real Estate Association (CREA) and identify real estate professionals who are members of CREA. Used under license. This listing content provided by REALTOR.ca has been licensed by REALTOR® members of The Canadian Real Estate Association. Not intended to solicit properties currently listed for sale or buyers under contract.
Century 21 Canada Limited Partnership currently has franchise opportunities available in select markets across Canada. The intent of this communication is for informational purposes only and is not intended to be a solicitation to anyone under contract with another real estate brokerage operation. This e-mail message contains confidential information intended only for the use of the individual or entity named above. Any unauthorized use or disclosure is strictly prohibited. If you have received this communication in error please immediately delete the e-mail and either notify the sender at the above e-mail address or by telephone.
© 2026 MoxiWorks
