
Leduc Real Estate Market Update: July 2026
The Leduc real estate market in July 2026 continues to show just how much market conditions have changed over the past year. Buyers have considerably more inventory to choose from, homes are taking longer to sell, and monthly sales have slowed compared with July 2025. At the same time, however, home prices remain strong — with July's average sale price climbing by more than 10% year-over-year.
That combination is important.
Rather than seeing a simple "hot" or "cool" market, Leduc appears to be settling into a more balanced environment. Buyers have more time and more selection, while sellers of desirable, appropriately priced homes are still achieving strong values.
According to the July 2026 Local Market Update from the REALTORS® Association of Edmonton, 81 properties sold during July, the average sale price reached $467,000, 157 new listings came to market, and homes took an average of 45 days to sell.
Let's take a closer look at the numbers and what they could mean if you're considering buying or selling a home in Leduc.
Leduc Real Estate Market Snapshot – July 2026
| Metric | July 2026 | Year-over-Year Change |
| Sold Properties | 81 | ↓ 13.83% |
| Average Asking Price | $496,000 | ↑ 5.40% |
| Average Sale Price | $467,000 | ↑ 10.44% |
| New Listings | 157 | ↑ 17.16% |
| Days on Market | 45 | ↑ 21.62% |
| Ask-to-Sell Ratio | 0.986 | ↓ 0.26% |
The headline numbers point to an interesting summer market: fewer transactions than last July, but substantially higher average sale prices and considerably more inventory for buyers to choose from.
🏗️ Leduc New Construction Market Update – July 2026 vs July 2025
New construction continued to be an important part of the Leduc real estate market in July 2026, with a substantial increase in the number of newly built homes sold compared with the same month last year.
A total of 19 new construction homes sold in July 2026, compared with just 8 in July 2025. That's an increase of 137.5% year-over-year and provides another indication that buyers continue to show strong interest in Leduc's growing new-home communities.
What makes July particularly interesting is that this increase in sales occurred while average new-home prices remained remarkably stable.
The average new construction sale price was $549,936 in July 2026, compared with $552,903 in July 2025 — a decrease of just 0.54%. In other words, the average price was essentially unchanged even though more than twice as many new homes were sold.
The median tells us a little more about the types of homes buyers purchased. The median new construction sale price decreased from $545,862 in July 2025 to $520,000 in July 2026, a decline of approximately 4.7%.
That suggests 2026 buyers had access to a broader selection of new homes at more attainable price points.
New Construction Price Range Expands
The range of new construction sales also widened significantly.
In July 2025, newly built homes sold between $455,200 and $637,500.
In July 2026, the range expanded to $390,555 to $765,000.
This is an important development for Leduc buyers because it demonstrates that new construction isn't limited to one segment of the market. The lower end has become more accessible while higher-end options have expanded at the same time.
The average list price remained almost unchanged, moving from $558,350 in July 2025 to $555,580 in July 2026.
⏱️ New Homes Are Selling Faster
Another positive indicator is the improvement in selling times.
New construction homes took an average of 59 days to sell in July 2026, compared with 65 days in July 2025, an improvement of approximately 9.2%.
The median days on market improved even more, dropping from 46 days in 2025 to just 36 days in 2026 — approximately 21.7% faster.
That's particularly noteworthy because the overall Leduc market is experiencing longer selling times this year. The July market report shows overall year-to-date days on market increased by 26.19% compared with 2025.
New construction appears to be bucking that broader trend.
📊 Leduc New Construction: July 2025 vs July 2026
| Metric | July 2025 | July 2026 | % Change |
|---|---|---|---|
| New Construction Sales | 8 | 19 | ↑ 137.5% |
| Average List Price | $558,350 | $555,580 | ↓ 0.5% |
| Average Sale Price | $552,903 | $549,936 | ↓ 0.5% |
| Median Sale Price | $545,862 | $520,000 | ↓ 4.7% |
| Highest Sale Price | $637,500 | $765,000 | ↑ 20.0% |
| Lowest Sale Price | $455,200 | $390,555 | ↓ 14.2% |
| Average Days on Market | 65 | 59 | ↓ 9.2% |
| Median Days on Market | 46 | 36 | ↓ 21.7% |
| Total Sales Volume | $4,423,225 | $10,448,794 | ↑ 136.2% |


Interactive bar graphs
Leduc New MLS® Listings
- New Listings Continue to Climb
Inventory continues to be one of the defining stories of the Leduc real estate market in 2026.
There were 157 new listings in July, an increase of 17.16% compared with July 2025.
The year-to-date difference is even more significant.
Through July:
2026: 989 new listings
2025: 749 new listingsThat's a 32.04% increase in new listings year-over-year.
An additional 240 properties have come onto the Leduc market during the first seven months of 2026 compared with the same period last year.
For buyers, this is welcome news.
Greater inventory means more opportunities to compare neighbourhoods, home styles, finishes, lot locations and price points. Buyers may not need to compromise as much as they did when inventory was extremely limited.
For sellers, the message is different: you have substantially more competition.
Simply putting a home on MLS® is no longer enough. Pricing, presentation, photography, marketing and overall condition can make a meaningful difference in how quickly a property attracts an offer.
-

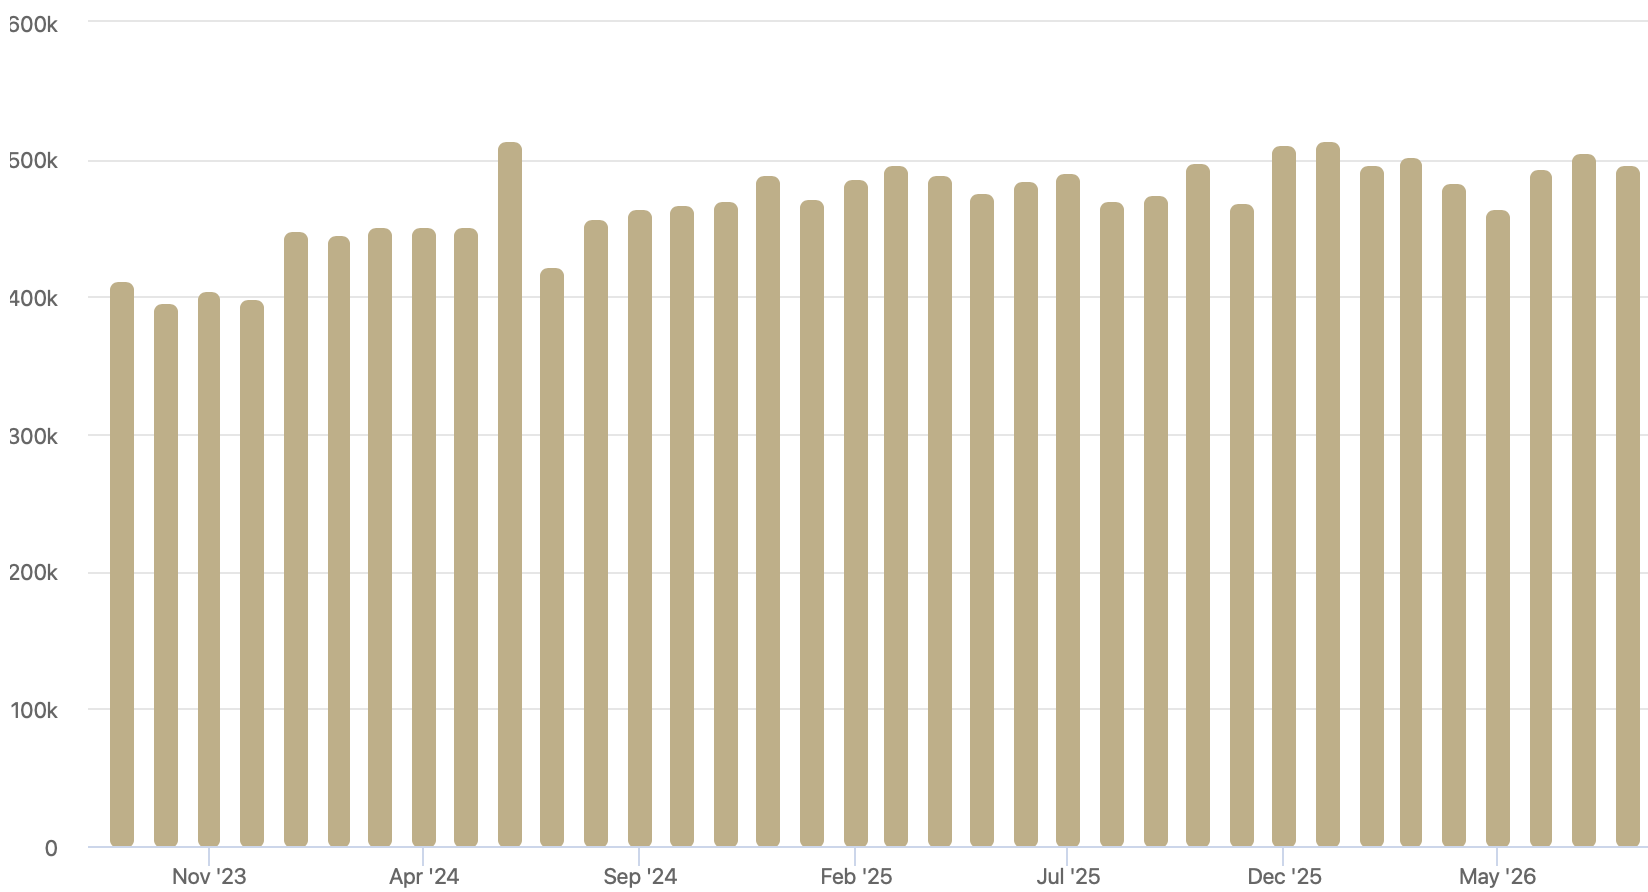
Average List Price
Average Asking Price – $496,000
The average asking price in Leduc reached $496,000 in July 2026, an increase of 5.40% compared with July 2025.
This is an interesting number when considered alongside the increase in inventory. Even though sellers face substantially more competition than they did last year, asking prices continue to trend upward.
On a year-to-date basis, Leduc's average asking price is $492,000 in 2026 compared with $483,000 in 2025, representing an increase of 1.83%.
For sellers, this demonstrates that property values remain well supported. However, higher average asking prices shouldn't be interpreted as permission to overprice.
With hundreds more listings entering the market this year, buyers can easily compare one home against another. A property that is priced above comparable homes may simply encourage buyers to purchase the competition.
Accurate pricing based on recent neighbourhood sales, property condition, upgrades and current competing inventory is becoming increasingly important.
Leduc Home Sales
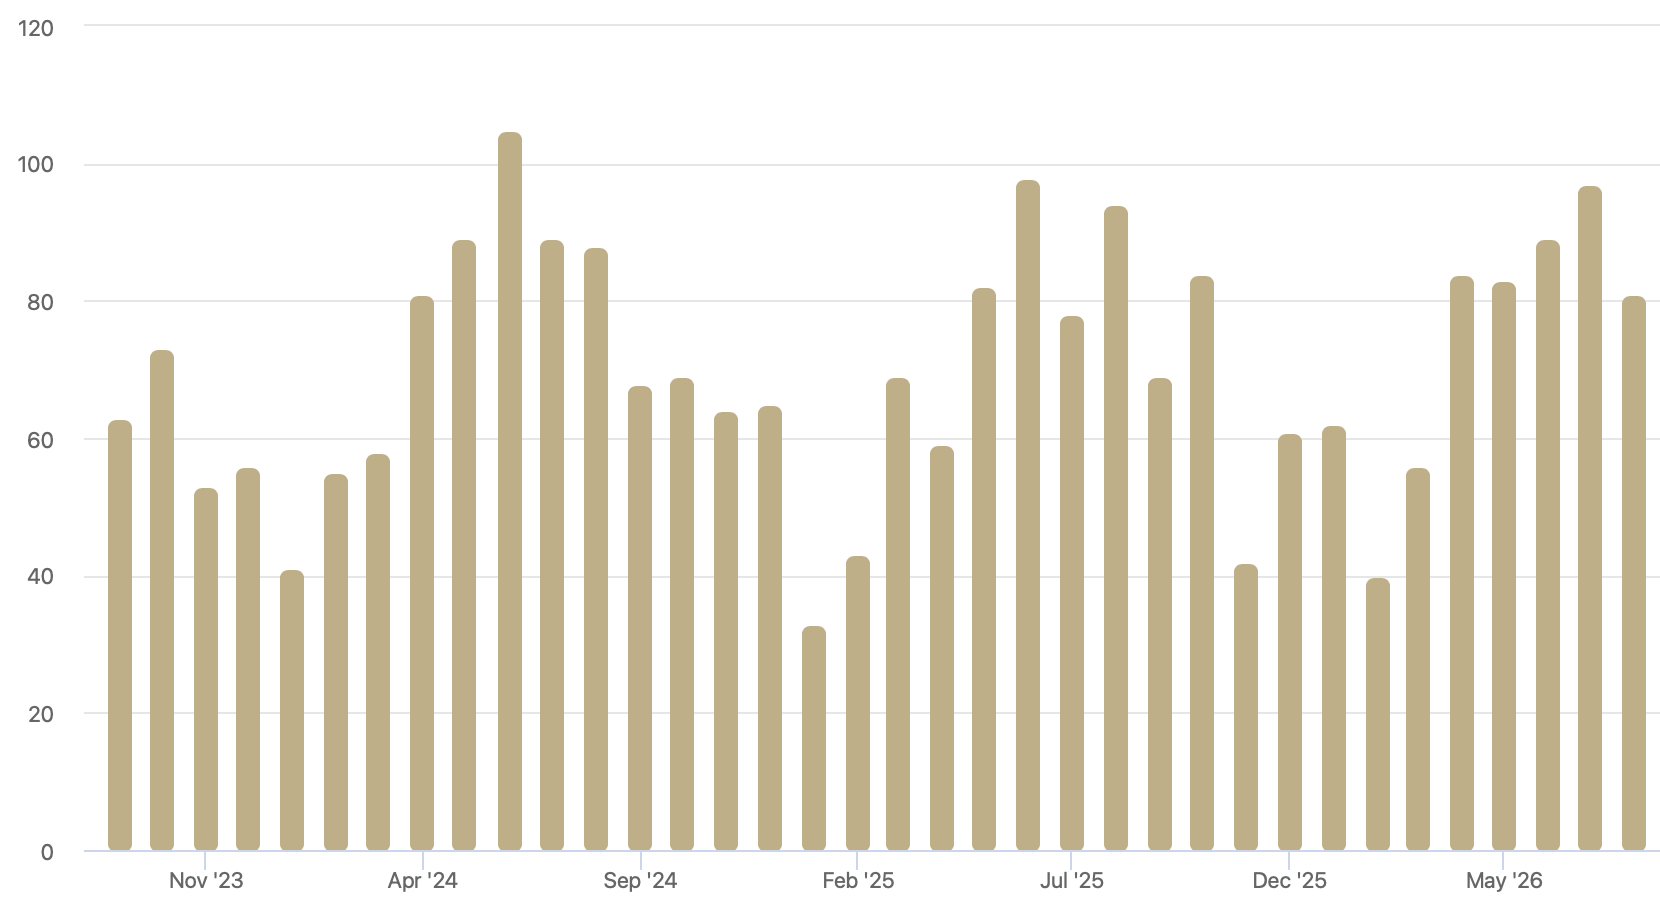
Leduc Home Sales – 81 Properties Sold in July
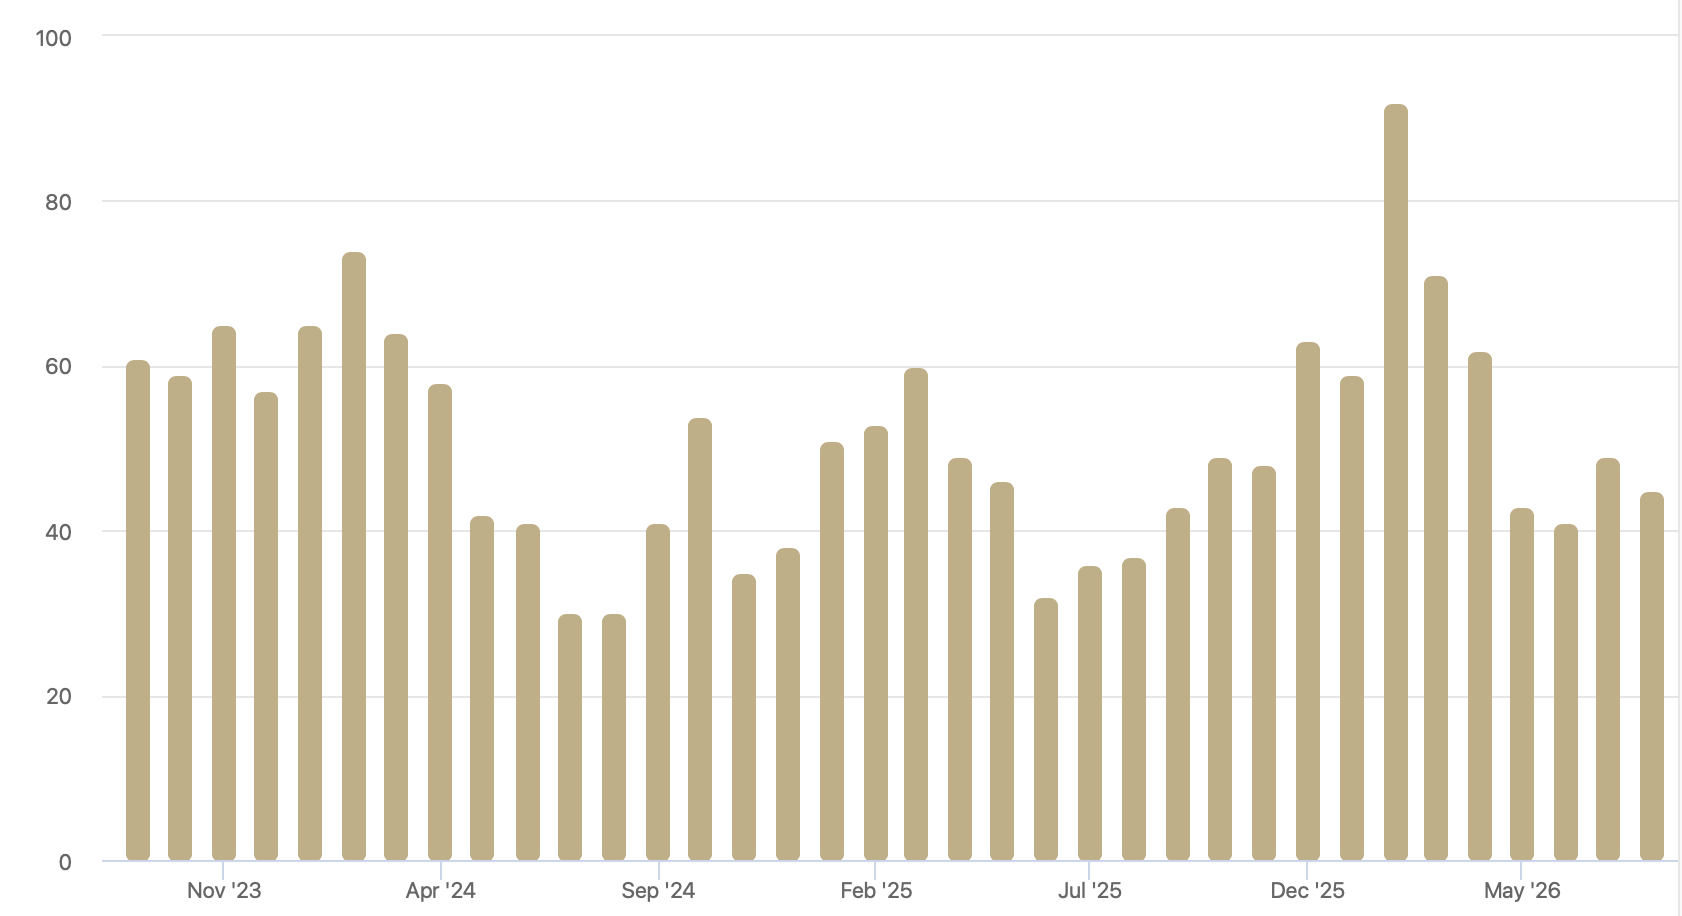
There were 81 properties sold in Leduc during July 2026, a 13.83% decrease from July 2025. The monthly sales chart in the report shows 94 sales last July compared with 81 this year.
This is quite a change from June, when Leduc experienced a particularly strong month with 97 sales.
However, one slower month shouldn't overshadow the broader trend. Year-to-date sales remain slightly ahead of last year.
Through the end of July, Leduc recorded 530 sales in 2026 compared with 523 in 2025, an increase of 1.34%.
In other words, despite July's year-over-year decline, more homes have sold during the first seven months of 2026 than during the same period last year.
That's an important distinction.
Demand hasn't disappeared. Instead, buyers are operating in a market where they have significantly more properties from which to choose.
Average Sale Price
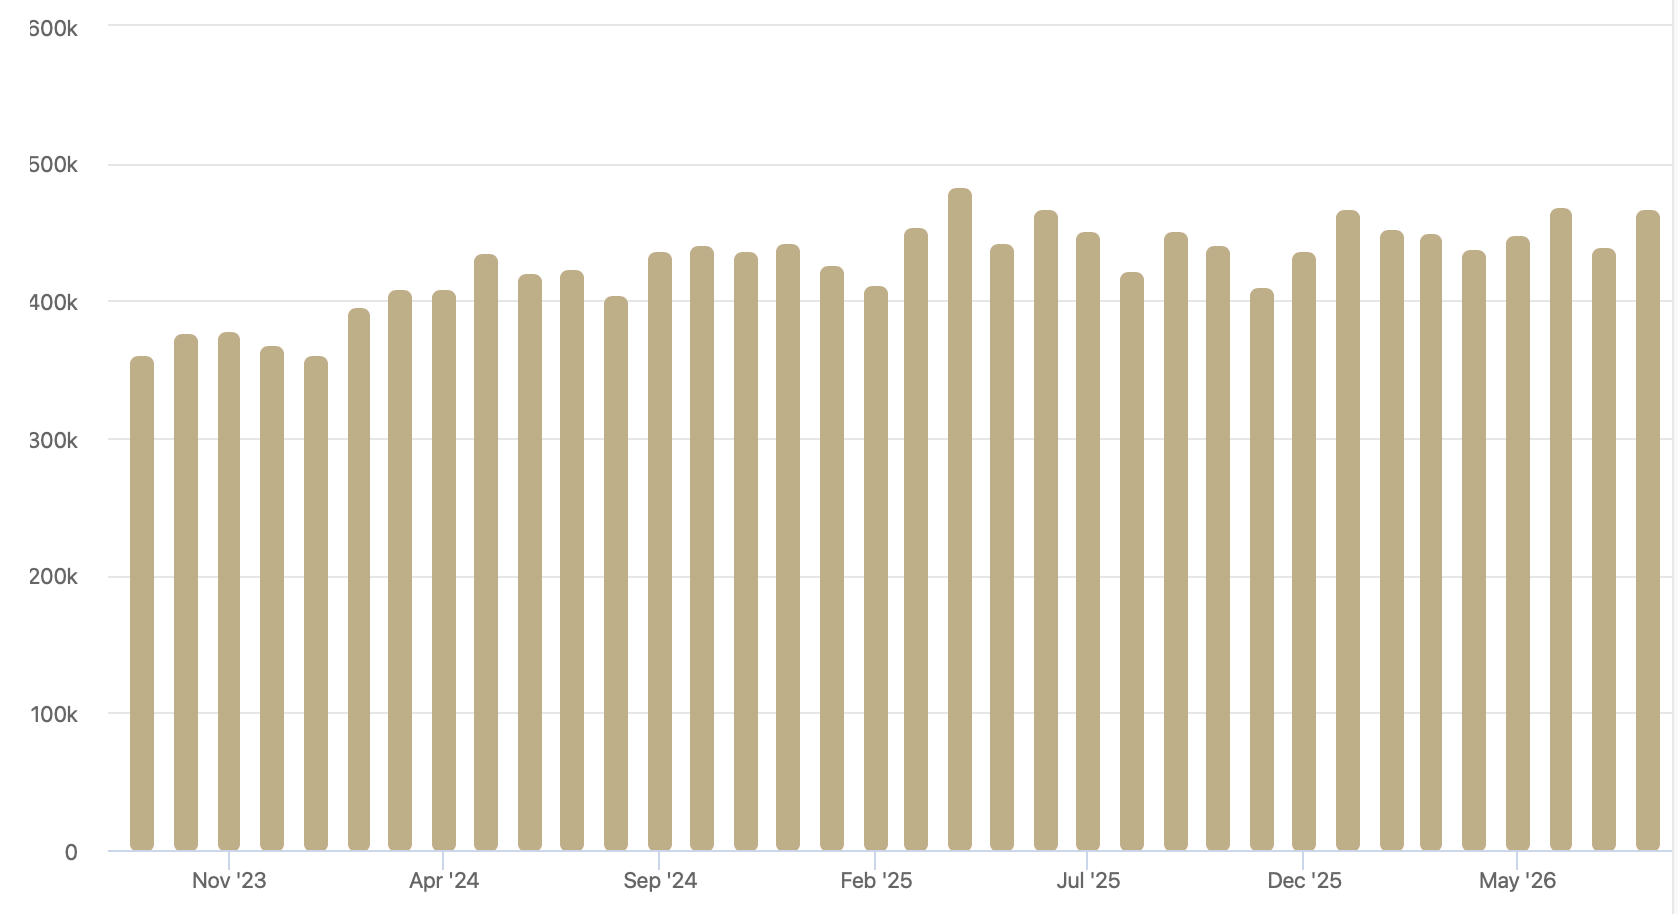
Average Sale Price Jumps 10.44%
Perhaps the biggest headline from the July 2026 Leduc housing market is the increase in the average sale price.
The average home sold for $467,000 in July, up an impressive 10.44% compared with July 2025.
That's particularly interesting because it happened during a month when sales volume decreased and inventory increased.
However, it's important not to assume that every Leduc property increased in value by 10.44%. Monthly averages can be influenced significantly by the types and price ranges of homes that happen to sell during a particular month. A greater proportion of higher-priced detached homes or new construction sales, for example, can push the overall average higher.
The year-to-date numbers provide a more measured view.
Through July, the average sale price is $452,000 in 2026 compared with $449,000 in 2025, representing a 0.79% increase.
That tells us that, across the first seven months of the year, Leduc home prices have been remarkably stable.
Ask-to-Sell Ratio Remains Strong
The average ask-to-sell ratio was 0.986 in July, meaning properties sold for approximately 98.6% of their asking price on average.
That's only 0.26% lower than last July.
Year-to-date, Leduc homes have achieved an average ratio of 98.8% in 2026 compared with 99.3% in 2025.
This reinforces an important point: even though buyers have more inventory and homes are taking longer to sell, sellers are still achieving prices relatively close to their asking price.
Correct pricing remains the key.
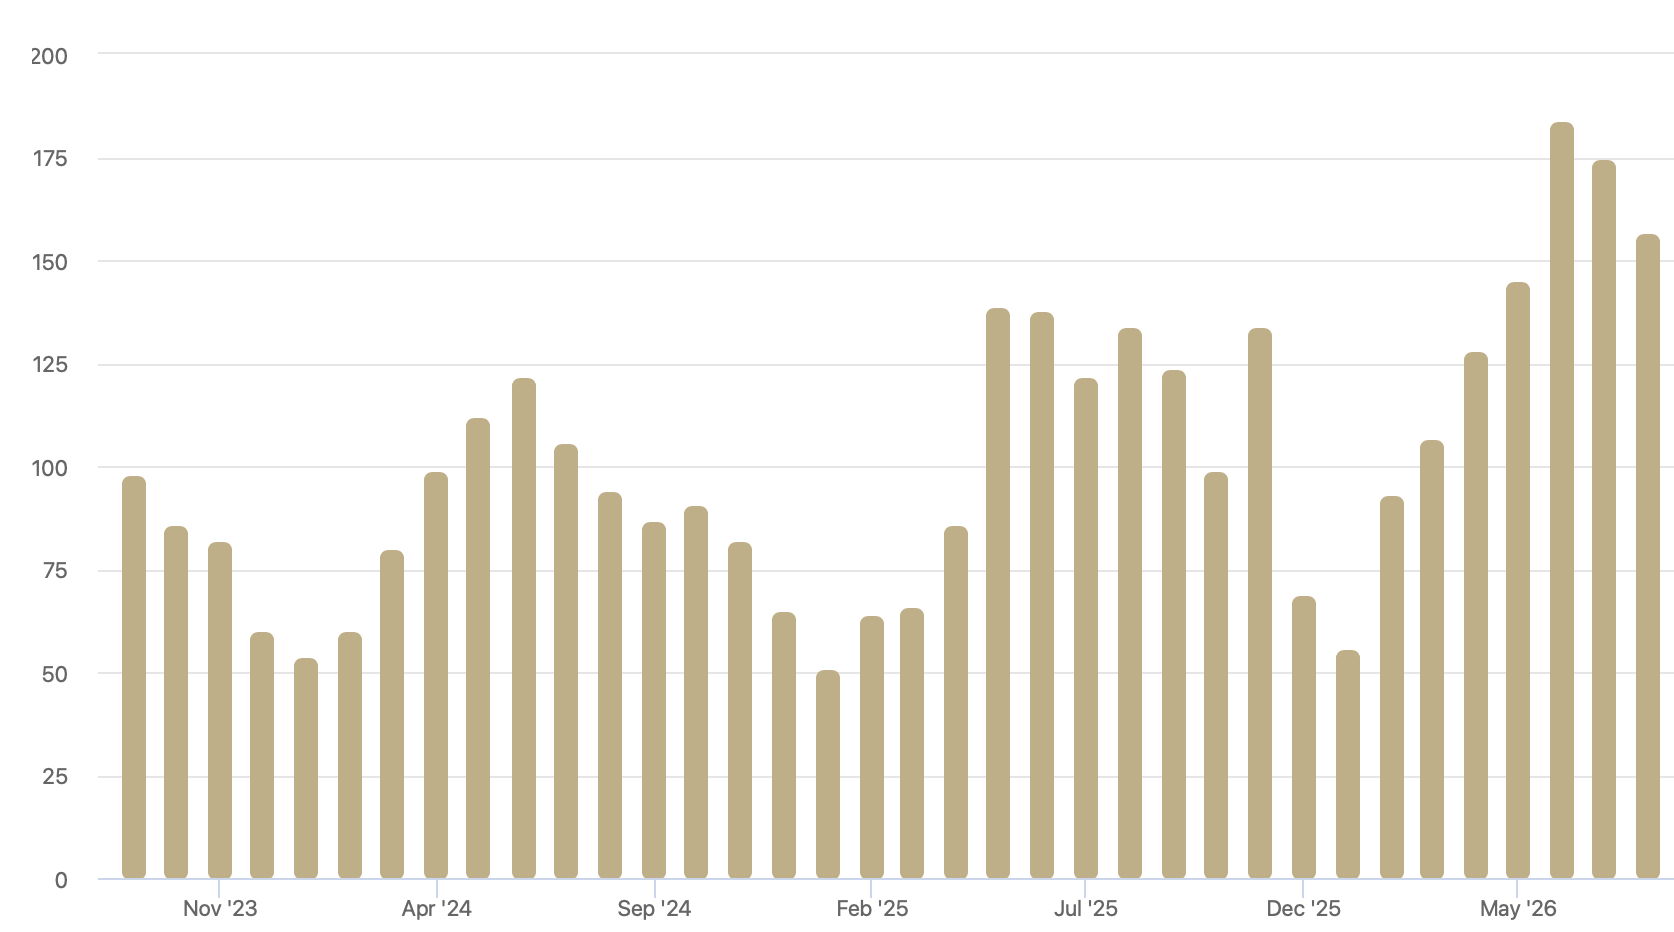
Average Days on Market
Homes Are Taking Longer to Sell
Leduc homes spent an average of 45 days on market in July 2026, compared with approximately 37 days last July — a 21.62% increase.
The year-to-date trend is even more pronounced.
Homes have taken an average of 53 days to sell so far in 2026, compared with 42 days in 2025, an increase of 26.19%.
That doesn't necessarily mean buyers aren't interested. Instead, it aligns closely with the dramatic increase in listings.
When buyers have more options, they have less reason to rush.
This makes the first few weeks on the market particularly important for sellers. A home that enters the market at the correct price and shows exceptionally well can capture buyers' attention while the listing is fresh.
July 2025 vs July 2026 Leduc Real Estate Comparison
| Metric | July 2025 | July 2026 | % Change |
| Sold Properties | 94 | 81 | ↓ 13.83% |
| Average Asking Price | ~$471,000 | $496,000 | ↑ 5.40% |
| Average Sale Price | ~$423,000 | $467,000 | ↑ 10.44% |
| New Listings | 134 | 157 | ↑ 17.16% |
| Days on Market | ~37 | 45 | ↑ 21.62% |
| Ask-to-Sell Ratio | ~0.989 | 0.986 | ↓ 0.26% |
Previous-year figures shown with "~" are derived from the July 2026 report's current figures and reported year-over-year percentage changes.
Leduc Year-to-Date Comparison – 2026 vs 2025
| Metric | 2025 YTD | 2026 YTD | % Change |
| Sold Properties | 523 | 530 | ↑ 1.34% |
| Average Asking Price | $483,000 | $492,000 | ↑ 1.83% |
| Average Sale Price | $449,000 | $452,000 | ↑ 0.79% |
| New Listings | 749 | 989 | ↑ 32.04% |
| Days on Market | 42 | 53 | ↑ 26.19% |
| Ask-to-Sell Ratio | 0.993 | 0.988 | ↓ 0.48% |
These year-to-date numbers may be the best summary of the 2026 Leduc market so far. Sales and prices are slightly higher, but inventory and selling times have increased dramatically.
What Do the July Numbers Mean for the Leduc Real Estate Market?
The July statistics reinforce a trend we've been watching throughout 2026: Leduc is moving toward a more balanced housing market without experiencing a significant decline in property values.
Consider the combination:
New listings are up 32.04% year-to-date, yet the average sale price is still 0.79% higher.
Homes are taking 26.19% longer to sell, yet year-to-date sales are still 1.34% ahead of 2025.
That's a much more nuanced story than simply saying the market is "up" or "down."
It suggests that additional supply is giving buyers more breathing room without overwhelming demand.
What Does This Mean for Leduc Home Buyers?
For buyers, the summer of 2026 offers something that has been difficult to find in recent years: choice.
With substantially more homes coming onto the market, buyers may have opportunities to compare multiple suitable properties rather than feeling pressured to make an immediate offer on the first acceptable home.
Longer selling times may also create negotiating opportunities, particularly on properties that have been listed for several weeks.
However, July's 10.44% increase in the average monthly sale price is a reminder that desirable homes can still command strong prices.
Having more negotiating power doesn't necessarily mean every property is negotiable. Well-priced homes in desirable locations can still attract strong interest.
What Does This Mean for Leduc Home Sellers?
For sellers, July's numbers are actually quite encouraging.
The average monthly sale price increased substantially, and homes continue to sell for close to their asking price.
But the 32% increase in year-to-date new listings changes how sellers need to approach the market.
Buyers have alternatives.
Before listing, sellers should carefully evaluate competing properties — not just recently sold homes. Your home needs to make sense relative to what a buyer can purchase today.
Professional photography, thoughtful staging, strong online marketing and an accurate pricing strategy become even more important when buyers have multiple comparable homes to choose from.
Leduc's Newer Communities Continue to Add Housing Choice
New construction also continues to influence the Leduc housing market. Growing communities such as Black Stone, Woodbend, Meadowview, Robinson and Southfork provide buyers with alternatives to the resale market, including quick-possession properties and newly built homes.
This is particularly important when interpreting average prices.
As we've seen in previous months, new construction can represent a meaningful portion of Leduc's sales and often sells at different price points than resale housing. Looking separately at builder and resale activity can therefore provide a much clearer picture of what's actually happening with home values.
I'll continue tracking this segment alongside the overall Leduc statistics throughout 2026.
What Could We See in the Leduc Market This Fall?
If the trends we've seen through July continue, the fall market could favour careful, informed decision-making rather than urgency.
Inventory may remain elevated compared with 2025, giving buyers continued selection. Sellers may need to be more responsive to showing activity, competing listings and buyer feedback.
At the same time, year-to-date sales remain ahead of last year and prices have held remarkably steady despite the increase in supply.
That combination suggests the underlying Leduc housing market remains healthy.
Rather than a dramatic shift toward either buyers or sellers, 2026 is increasingly looking like a year of balance.
Why Buyers Continue to Choose Leduc
Leduc continues to appeal to buyers who want access to Edmonton while enjoying the lifestyle of a smaller city. Its proximity to Edmonton International Airport, Highway 2, employment areas and regional amenities makes it particularly attractive to commuters.
The city also offers a diverse mix of established neighbourhoods, newer communities, resale homes and new construction.
For families, first-time buyers, move-up buyers and downsizers, that variety provides opportunities across numerous price points and property styles.
Thinking About Buying or Selling a Home in Leduc?
Market-wide statistics are useful, but they don't tell you exactly what your home is worth or what is happening in the specific Leduc neighbourhood where you want to buy.
Property type, age, condition, location, lot, upgrades and competing inventory can all produce very different results from the city-wide average.
If you're considering selling, I can prepare a detailed market analysis based on your home and its direct competition.
If you're buying, I can help you compare resale properties with new construction opportunities and determine where you're getting the best value for your budget.
Chris Reid, REALTOR®
Century 21 Leading
Call or text: (780) 717-5267
chrisreidedmonton.com
If you would like more information on the Leduc real estate market contact Chris Reid

CENTURY 21 Leading
INFO & SERVICES
CENTURY 21 Leading
14315 118 Ave NW, Unit 130, Edmonton, AB T5L4S6
(780) 455-0777
INFO & SERVICES

Independently Owned and Operated. ®/™ trademarks owned by Century 21 Real Estate LLC used under license or authorized sub-license. © 2020 Century 21 Canada Limited Partnership © 2020 Century 21 Canada Limited Partnership
The trademarks MLS®, Multiple Listing Service® and the associated logos identify professional services rendered by REALTOR® members of CREA to effect the purchase, sale and lease of real estate as part of a cooperative selling system. The trademarks REALTOR ® , REALTORS ® and the REALTOR ® logo are controlled by The Canadian Real Estate Association (CREA) and identify real estate professionals who are members of CREA. Used under license. This listing content provided by REALTOR.ca has been licensed by REALTOR® members of The Canadian Real Estate Association. Not intended to solicit properties currently listed for sale or buyers under contract.
Century 21 Canada Limited Partnership currently has franchise opportunities available in select markets across Canada. The intent of this communication is for informational purposes only and is not intended to be a solicitation to anyone under contract with another real estate brokerage operation. This e-mail message contains confidential information intended only for the use of the individual or entity named above. Any unauthorized use or disclosure is strictly prohibited. If you have received this communication in error please immediately delete the e-mail and either notify the sender at the above e-mail address or by telephone.
© 2026 MoxiWorks
