Facebook
 X
X
 Pinterest
 Copy Link
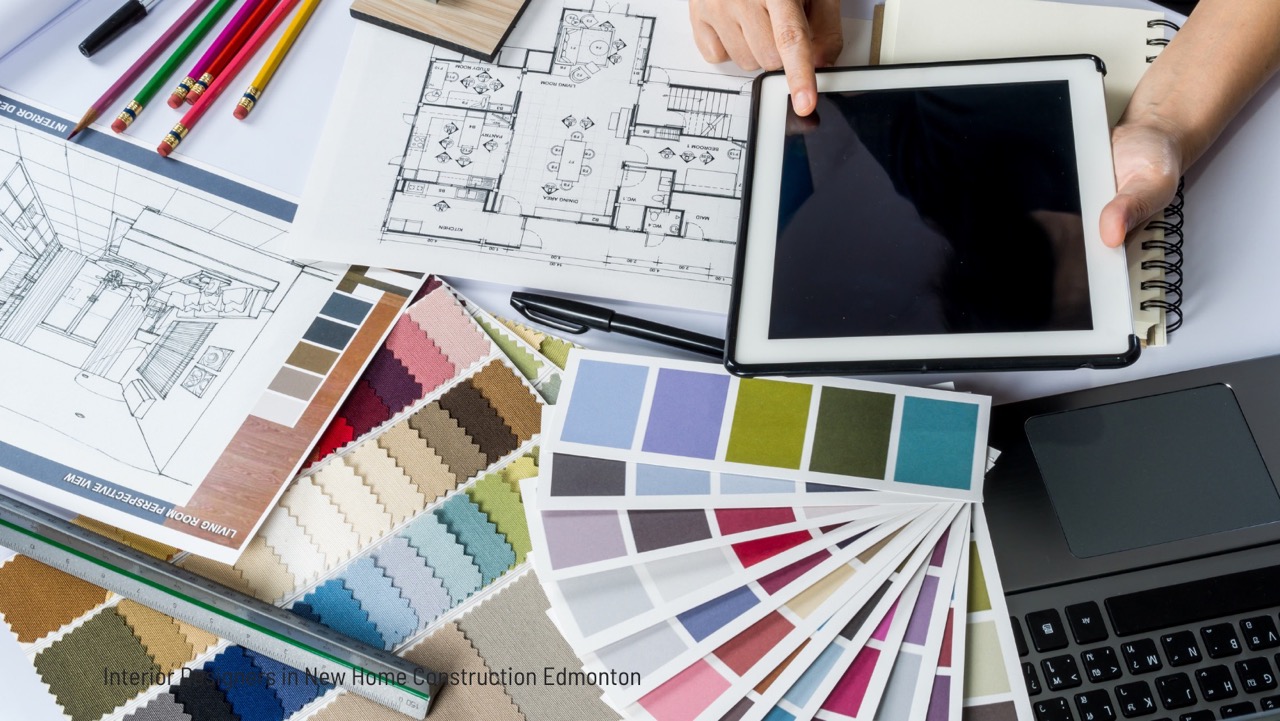
Interior Designers in new home construction are an intergal part of the process. When it comes to new home construction, interior design often takes a backseat to structural planning and architectural aesthetics. However, integrating the expertise of an interior designer early in the construction process can significantly enhance the functionality, beauty, and value of your Edmonton home. This blog delves into the pivotal role interior designers play in the construction of new homes, emphasizing their importance for homeowners looking to create unique, comfortable, and timeless spaces.
Why Interior Designers Are Essential in New Home Construction
1. Bridging the Gap Between Vision and Reality
Building a new home in Edmonton offers an exciting opportunity to tailor every aspect to your preferences. Yet, turning abstract ideas into a cohesive design is no easy feat. Interior designers specialize in translating your vision into actionable plans, ensuring your new home reflects your style while maintaining practicality.
2. Maximizing Functionality
Interior designers assess spaces with a focus on optimizing layout and functionality. From planning furniture placement to considering lighting and traffic flow, their insights ensure every square foot of your home serves a purpose. This is especially valuable in Edmonton, where families often seek homes that balance cozy living with modern convenience.
3. Enhancing Aesthetic Appeal
An interior designer can transform a blank canvas into a work of art. By selecting materials, colors, and textures that harmonize with the architectural style, they create interiors that are not only visually stunning but also cohesive and inviting.
The Interior Design Process in New Construction Homes
Step 1: Initial Consultation
Interior designers begin by understanding your lifestyle, preferences, and long-term goals. This phase includes discussions about design inspiration, functional requirements, and budget constraints.
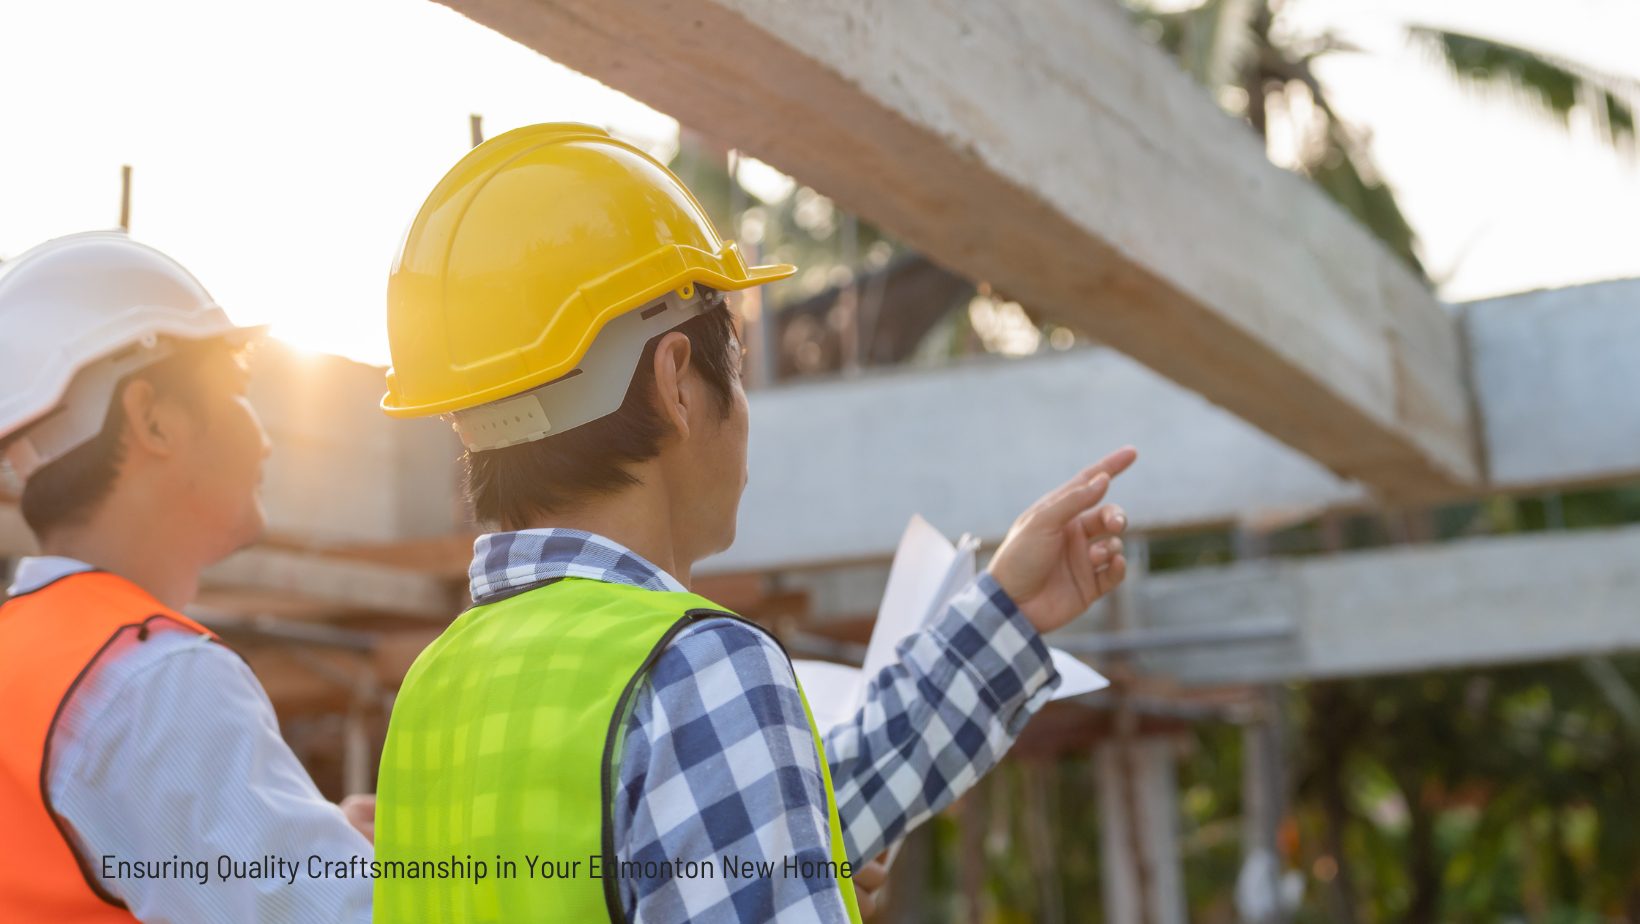
Step 2: Collaborating with Builders and Architects
Effective collaboration between designers, architects, and builders is crucial. Interior designers bring a unique perspective to construction plans, ensuring details like electrical outlet placement, lighting fixtures, and built-in storage solutions align with the homeowner’s vision.
Step 3: Material and Finish Selection
From flooring to cabinetry, designers guide you through the selection of materials that suit your budget and aesthetic preferences. Their industry knowledge ensures you choose durable, high-quality options that elevate the overall design.
Step 4: Spatial Planning and Layout Design
Interior designers use advanced tools and software to create 3D renderings of your home’s interior, helping you visualize how furniture and décor will fit into the space.
Step 5: Final Touches and Styling
Once construction is complete, designers focus on adding finishing touches, including furnishings, décor, and artwork, to bring your new home to life.
Benefits of Hiring an Interior Designer for Your Edmonton Home
1. Increased Property Value
Well-designed homes attract higher resale values. Prospective buyers in Edmonton’s competitive market often prioritize homes with thoughtfully designed interiors.
2. Cost Efficiency
While hiring an interior designer is an upfront investment, it can save money in the long run by avoiding costly mistakes. Designers can also recommend cost-effective materials and finishes that achieve your desired look without exceeding your budget.
3. Personalized Design
Interior designers tailor every aspect of the home to your preferences, creating a space that feels uniquely yours.
4. Stress Reduction
Managing construction projects can be overwhelming. Designers alleviate much of this stress by handling everything from sourcing materials to coordinating with contractors.
Edmonton’s Interior Design Trends for New Homes
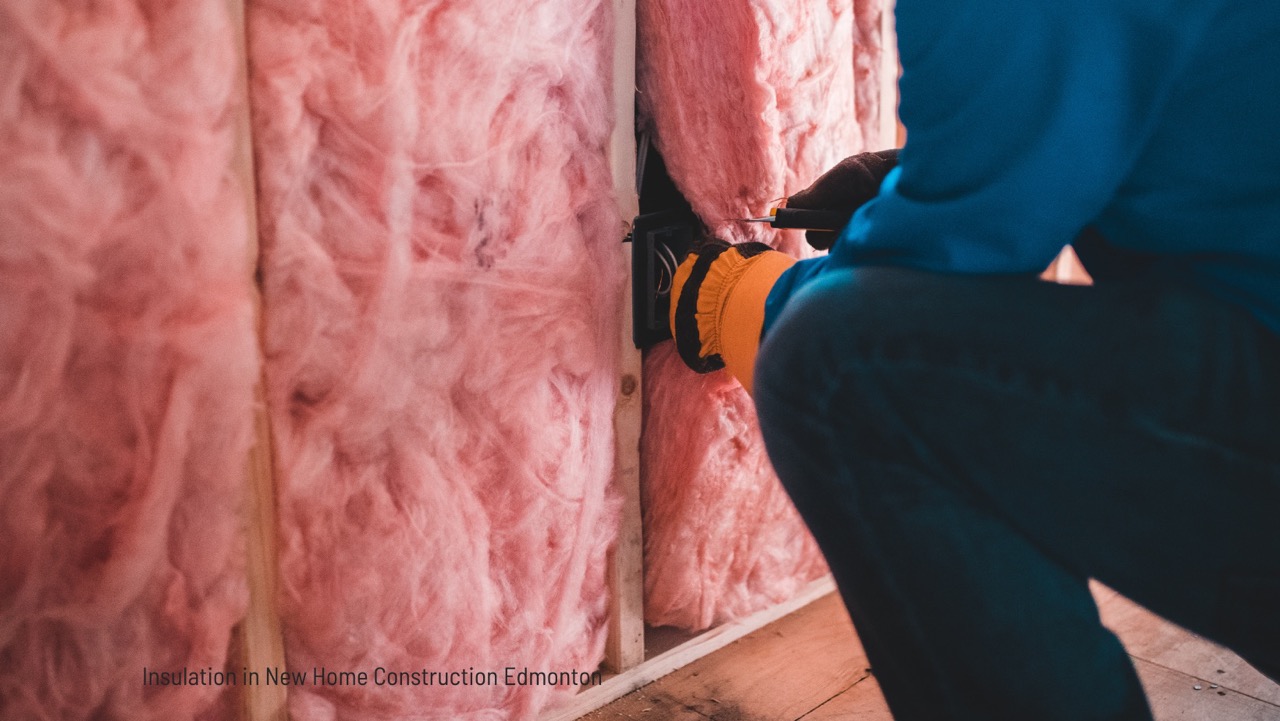
Sustainable Design
Edmonton homeowners are increasingly opting for eco-friendly materials and energy-efficient features. Interior designers are instrumental in sourcing sustainable products that align with these values.
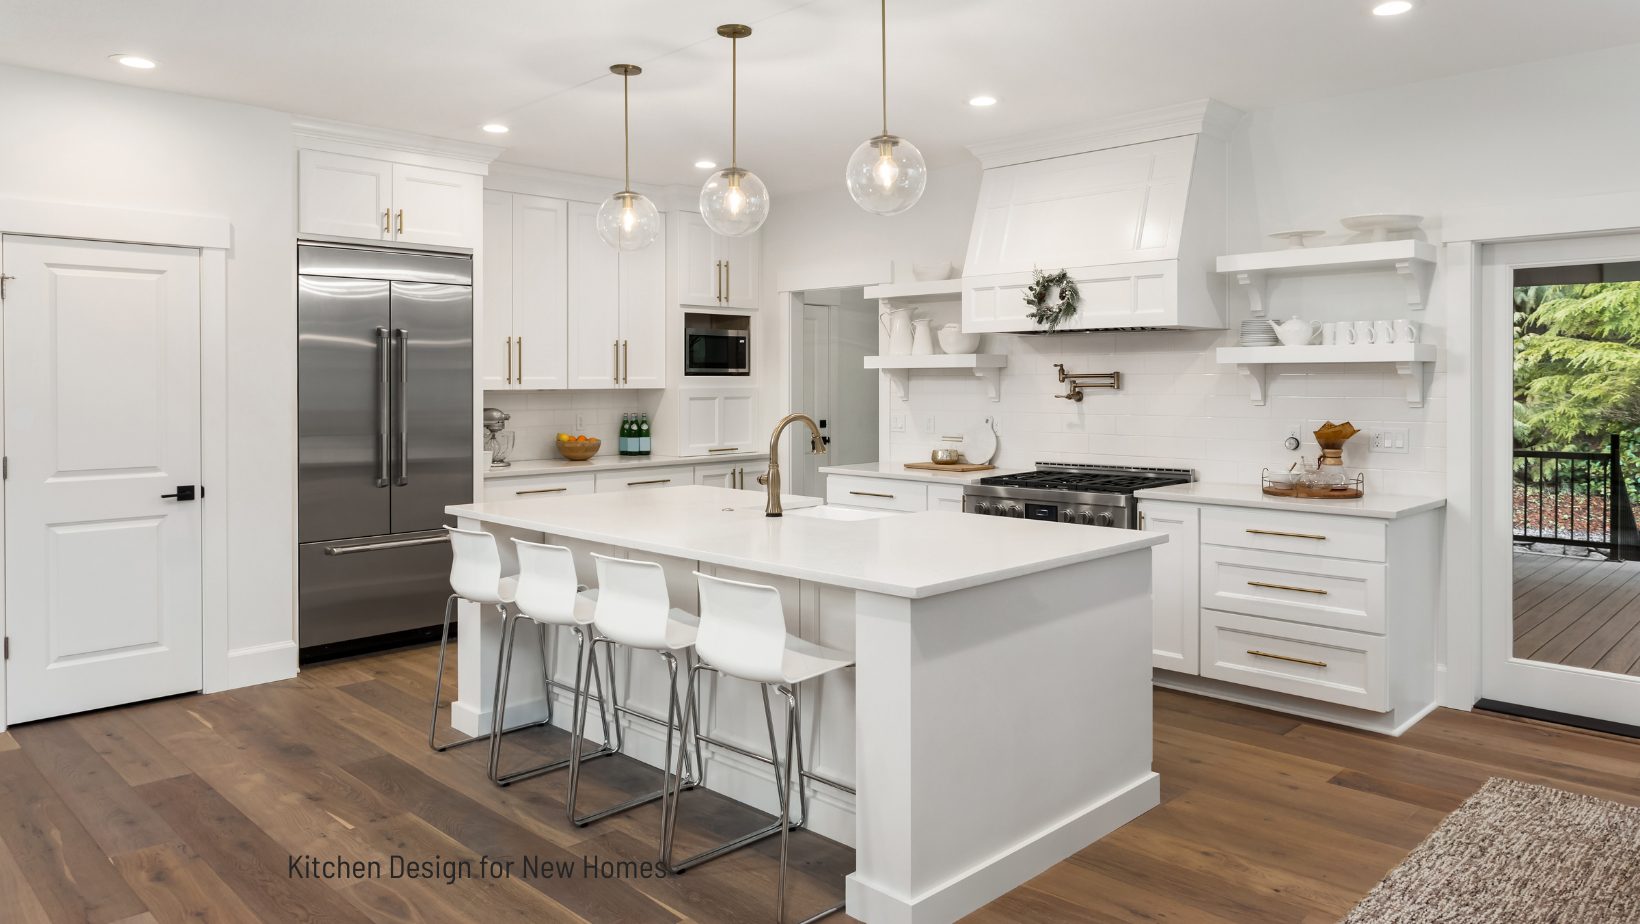
Open-Concept Living
Open layouts remain popular in Edmonton, creating seamless transitions between living, dining, and kitchen areas. Designers enhance these spaces with cohesive design elements that maintain flow and functionality.
Smart Home Integration
From automated lighting to advanced security systems, interior designers incorporate smart technologies into new builds, ensuring your home is both stylish and future-proof.
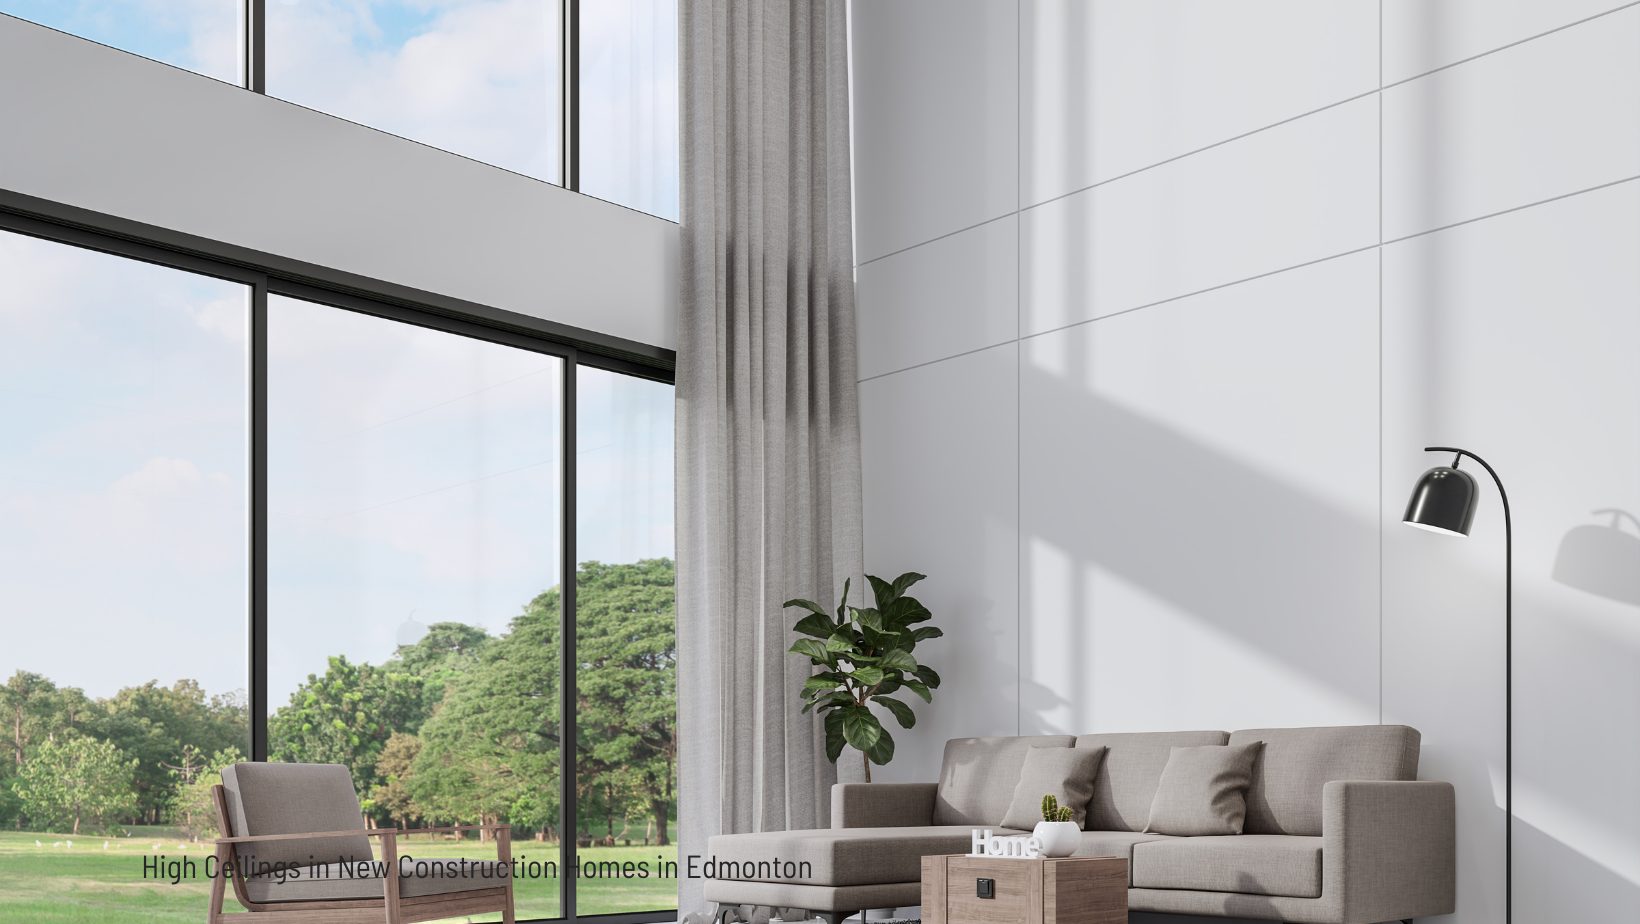
Biophilic Design
Edmonton’s natural beauty inspires homeowners to bring the outdoors in. Interior designers achieve this by incorporating natural materials, large windows, and indoor plants.
How to Choose the Right Interior Designer for Your New Home
1. Review Portfolios
Examine a designer’s past projects to ensure their style aligns with your vision.
2. Check Credentials
Look for certifications and memberships in professional organizations like the Interior Designers of Alberta (IDA).
3. Seek Recommendations
Ask builders, architects, or friends in Edmonton for recommendations on reliable interior designers.
4. Discuss Budget and Timeline
Clear communication about budget and deadlines ensures the designer can meet your expectations.
Tips for Working with an Interior Designer
- Communicate Clearly: Share your preferences, budget, and timeline upfront to ensure the designer’s work aligns with your expectations.
- Be Open to Ideas: Designers may suggest creative solutions you hadn’t considered.
- Trust the Process: Interior design is a collaborative effort. Trust your designer’s expertise while providing feedback when necessary.
Conclusion: Elevate Your Edmonton Home with Interior Design
Interior designers play an indispensable role in the construction of new homes, blending functionality with aesthetics to create spaces that reflect the unique lifestyles of Edmonton homeowners. From concept to completion, their expertise ensures your new build is a harmonious blend of style, comfort, and practicality.
If you’re embarking on a new home construction journey in Edmonton, consider partnering with an interior designer to unlock the full potential of your living spaces. Your dream home deserves nothing less than a thoughtful and expertly crafted design.
Have more questions about Interior Designers in New Home Construction? Contact Chris Reid Edmonton REALTOR®.
For more insights into Edmonton’s real estate market, follow me on Facebook, Instagram, and YouTube. Stay updated on the latest new build opportunities and exclusive deals!