
Leduc Real Estate Market Update: September 2025
The Leduc real estate market remains active as ever. With its ideal location just south of Edmonton, growing family-oriented communities, and solid price growth over time, Leduc continues to be a destination of choice for both homeowners and investors.
As we review the September 2025 market stats, it's clear the local market remains robust—especially compared to the same period in 2024. While sales volume year-to-date is slightly down, the month of September itself saw a large rebound in activity. Inventory levels are climbing, and although average prices are beginning to stabilize, the long-term trend remains upward.
📊 Key Market Statistics – September 2025
Here are the highlights from the REALTORS® Association of Edmonton report for Leduc:
| Metric | September 2025 | YoY Change |
| Sold Properties | 84 | ↑ 21.74% |
| YTD Sold Properties | 676 | ↓ 3.70% |
| Average Asking Price | $501,000 | ↑ 6.95% |
| YTD Average Asking Price | $484,000 | ↑ 5.24% |
| Average Sale Price | $441,000 | ↑ 0.15% |
| YTD Average Sale Price | $448,000 | ↑ 6.53% |
| New Listings | 99 | ↑ 8.79% |
| YTD New Listings | 972 | ↑ 14.22% |
| Average Days on Market | 49 days | ↓ 9.26% |
| YTD Days on Market | 43 days | ↓ 6.52% |
| Ask-to-Sell Ratio | 0.981 | ↓ 0.28% |


Interactive bar graphs
Leduc New MLS® Listings
🆕 Inventory Growth Brings Choice to Buyers
The number of new listings in Leduc rose by 8.79% in September, with 99 homes hitting the market—up from 91 the year prior. Year-to-date, 972 new listings have been recorded, representing a 14.22% increase over 2024
This is great news for buyers:
- More options mean less pressure to compete.
- Better selection can reduce the need to compromise on features, location, or condition.
- Negotiation power shifts more toward balanced market conditions.
For sellers, this means one thing: differentiation matters. With more properties on the market, pricing, staging, photography, and promotion all play a crucial role in attracting serious buyers.
Average List Price
In September 2025, Leduc’s average asking price climbed to $501,000, marking a 6.95% increase over September 2024
. This significant uptick reflects ongoing seller confidence in the market despite increasing inventory. It also suggests that homeowners believe their properties continue to hold strong value within the broader Edmonton metropolitan region. The year-to-date average list price also rose to $484,000, up 5.24% from the same time last year, further supporting the trend of long-term appreciation in the area. While list prices remain strong, sellers should take note of buyer behaviour and ensure their pricing aligns with current market conditions—especially as competition grows.
Leduc Home Sales
📈 Monthly Sales Surge Despite Year-to-Date Dip
One of the biggest stories in Leduc’s September real estate market is the strong monthly sales recovery. 84 homes were sold this month, marking a 21.74% increase compared to September 2024
While year-to-date sales are still slightly behind last year—down 3.70% overall—this surge suggests renewed buyer activity heading into the fall market. This could be the result of:
- Seasonal relocations for families ahead of the school year
- Lower interest rates compared to earlier in the year
- A response to stabilizing price growth
The September uptick is a strong indicator that buyer confidence remains intact, and could signal a healthy finish to the 2025 selling season.
Average Sale Price
Leduc’s average sale price in September 2025 reached $441,000, a modest but positive 0.15% increase year-over-year. This marginal rise indicates a cooling in month-over-month appreciation after several periods of sharp increases earlier in the year. However, the year-to-date average sale price of $448,000 represents a more substantial 6.53% increase compared to 2024, showing that homes are still gaining value on a longer timeline. This balance between monthly stability and annual growth signals that the Leduc market is entering a more sustainable phase, offering opportunity for both cautious buyers and strategic sellers.
📉 Ask-to-Sell Ratio Dips Slightly
The average ask-to-sell ratio dropped to 0.981, indicating homes sold for 98.1% of their asking price in September—down 0.28% compared to last year. This subtle decline reflects the growing inventory and signals that negotiation is back on the table. Buyers may have slightly more room to negotiate, especially on homes that are:
- Overpriced
- Poorly presented
- In less desirable locations
Still, a ratio above 98% suggests that most sellers are pricing correctly and that homes are still selling close to list value.
Average Days on Market
⌛ Homes Selling Faster Than Before
A somewhat surprising figure in this month’s report is the decrease in average days on market:
- Average Days on Market (September): 49 days (↓ 9.26% YoY)
- YTD Average Days on Market: 43 days (↓ 6.52% YoY)
This suggests that, despite increasing inventory, buyers are still acting quickly on homes they perceive to be a good fit and priced well.
It also means that sellers should be ready to move once their home hits the market. Ensure that financing, legal, and moving plans are in place prior to listing.
🛍️ What It Means for Buyers
The current market conditions in Leduc are favourable for buyers in several ways:
- More Listings, Less Pressure
The growing number of active listings reduces competition and provides more opportunities to compare. - Prices Are Levelling
Month-over-month growth is stable, so there's less urgency to act on fear of runaway prices. - Room to Negotiate
With the ask-to-sell ratio slipping slightly, buyers may be able to secure better deals, especially on homes that have been sitting longer. - Still Need to Be Prepared
Desirable homes are still moving quickly. Pre-approvals and decision-making readiness are key.
💼 What It Means for Sellers
Sellers still have the advantage—but they need to be strategic in order to stand out:
- Set the Right Price
Overpricing is risky in a shifting market. Rely on local comps and expert guidance to find the sweet spot. - Presentation Sells
In a market with rising inventory, staging, professional photography, and digital marketing make all the difference. - Act Soon
If you’re considering listing, the fall market still presents an excellent opportunity before winter slows buyer activity. - Respond to the Market
Be prepared to adjust quickly based on showing feedback and competing listings.
🏘️ Top Neighbourhoods in Leduc Right Now
Several Leduc communities remain highly sought after in 2025:
- Black Stone: Newer builds, modern finishes, and strong resale value.
- Meadowview: Quiet and family-friendly with parks and trails.
- Southfork: Affordable and diverse, great for first-time buyers.
- West Haven: Balanced mix of detached, duplex, and townhome offerings.
Whether you’re buying or selling in these neighbourhoods, local expertise is essential. I’m happy to provide detailed comps and market strategy tailored to your area.
🧭 Why Leduc Remains a Smart Real Estate Move
Leduc continues to be one of Alberta’s strongest mid-sized markets thanks to:
- Affordability Compared to Edmonton: More space for your money.
- Quick Commute: Just 15 minutes to Edmonton or the airport.
- Lifestyle Amenities: Leduc Recreation Centre, trails, shopping, and schools.
- Continued Investment: Both residential and commercial growth support long-term value.
For families, commuters, and investors alike, Leduc offers the perfect balance of location, value, and lifestyle.
📊 YTD 2025 vs. 2024 Market Comparison
Here’s how the Leduc real estate market compares year-to-date:
| Metric | YTD 2025 | YTD 2024 | % Change |
| Sold Properties | 676 | 702 | ↓ 3.70% |
| Average Asking Price | $484,000 | $460,000 | ↑ 5.24% |
| Average Sale Price | $448,000 | $421,000 | ↑ 6.53% |
| New Listings | 972 | 851 | ↑ 14.22% |
| Days on Market | 43 | 46 | ↓ 6.52% |
| Ask-to-Sell Ratio | 0.991 | 0.993 | ↓ 0.20% |
🏁 Final Takeaways
- Sales rebounded strongly in September, but YTD totals still lag behind 2024.
- Inventory growth is giving buyers more choice, which is easing pressure and leading to a more balanced market.
- Home prices continue to appreciate, though at a more moderate pace.
- Homes are selling slightly faster, especially when well-priced and well-presented.
📞 Thinking About Buying or Selling in Leduc?
Let’s talk. I’m Chris Reid, a REALTOR® with Century 21 Leading, proudly serving Leduc and the Greater Edmonton Area.
Whether you’re buying your first home, moving up, downsizing, or investing, I’m here to provide honest advice, detailed market knowledge, and a proven strategy to get you results.
📧 creid@chrisreidedmonton.com
📱 (780) 717-5267
Let’s make your next real estate move a confident one.
If you would like more information on the Leduc real estate market contact Chris Reid
City of Leduc Website

Edmonton Condo Real Estate Market September 2025
As the leaves turn and we settle into fall, the Edmonton condo market continues to show signs of transition. While year-to-date sales have slowed, both asking and selling prices are rising, and new listings are keeping inventory flowing for buyers still actively searching for their perfect condo.
If you're considering buying or selling a condo in Edmonton, staying up to date with market trends is crucial. This September 2025 update breaks down the key performance indicators for the condo market, including price movement, sales activity, inventory, and market timing.
📊 Key Stats at a Glance – September 2025
| Metric | September 2025 | September 2024 | % Change |
| Sold Properties | 286 | 325 | ↓ 12.00% |
| Average Asking Price | $239,000 | $234,000 | ↑ 1.99% |
| Average Sale Price | $201,000 | $195,000 | ↑ 3.10% |
| New Listings | 566 | 528 | ↑ 7.20% |
| Days on Market | 67 | 73 | ↓ 8.22% |
| Ask-to-Sell Ratio | 0.965 | 0.966 | ↓ 0.01% |
Let’s break down each of these statistics and what they mean for buyers, sellers, and investors.


Bar Graphs Below Are Interactive
Edmonton Condo New MLS® Listings
🏠 New Listings: A Healthy 7.20% Increase
Edmonton saw 566 new condo listings in September 2025, up from 528 last year — a 7.20% increase. Year-to-date, 5,586 new condos have been listed, which is 4.69% more than the 5,336 listed in the same period of 2024.
More listings mean:
- Buyers have more options and room to negotiate.
- Sellers will need to differentiate their property with standout marketing, staging, and pricing to stand out in a crowded field.
If you’re a seller wondering when to list, remember: the fall market still attracts serious buyers, especially with mortgage pre-approvals in hand and timelines before winter.
Average List Price Edmonton Condos
💲 Average Asking Price Rises to $239,000
In September, the average asking price for an Edmonton condo rose to $239,000, representing a 1.99% increase over last year. On a year-to-date basis, the average sits at $236,000, holding steady with a minimal 0.06% increase compared to 2024.
Why this matters:
- Sellers are maintaining strong price expectations.
- Buyers should budget carefully — even if fewer condos are selling, the ones that are listed aren’t seeing massive price drops.
The steady asking price trend also suggests that Edmonton’s condo market remains resilient — especially compared to other Canadian cities experiencing deeper pricing corrections.
Edmonton Condo Sales
🏢 Condo Sales: Volume Drops Again in September
There were 286 condos sold in September 2025, which marks a 12% decrease compared to September 2024. Year-to-date, 3,061 condos have sold across the city — down 6.62% from 3,278 sales in the same period last year.
This reduction in volume can largely be attributed to:
- Rising interest rates affecting buyer qualifications
- Inventory shifts creating more buyer choice (and longer decision timelines)
- Seasonal slowdown heading into the fall
For buyers, fewer sales mean reduced competition — a positive sign. For sellers, this highlights the importance of pricing and presentation in a slower-paced market.
Edmonton Average Condo Sale Price
💰 Average Sale Price Climbs to $201,000
While sales volumes have decreased, pricing is holding strong. The average sale price for condos in September 2025 hit $201,000, up 3.10% from the same month in 2024. Year-to-date, the average sale price stands at $209,000, which is an impressive 6.22% increase from $197,000 in 2024.
Key insight: Buyers may have more choice, but sellers who list their units competitively are still commanding strong values.
📉 Ask-to-Sell Ratio Holds Strong at 96.5%
The average ask-to-sell ratio in September 2025 was 0.965, a slight 0.01% decrease from last year. Year-to-date, the ratio is 0.968, just a hair under the 0.969 recorded in 2024.
This indicates that:
- Sellers are achieving close to their asking prices.
- There isn’t widespread discounting in the condo market.
- Buyers may not have as much price negotiation room as they might think — especially on desirable or newer units.
Average Days on Market
⏱️ Days on Market Shorten to 67 Days
Condos are selling faster than last year. In September 2025, the average time it took to sell a condo in Edmonton was 67 days, a notable 8.22% improvement over the 73-day average in September 2024. Year-to-date, the average is also 67 days, down from 70 last year.
This signals that well-priced and well-presented condos are moving — even in a market with more listings and slower overall sales.
📅 YTD Comparison Table (2025 vs 2024)
| Metric | 2025 YTD | 2024 YTD | % Change |
| Sold Properties | 3,061 | 3,278 | ↓ 6.62% |
| Average Asking Price | $236,000 | $236,000 | ↑ 0.06% |
| New Listings | 5,586 | 5,336 | ↑ 4.69% |
| Days on Market | 67 | 70 | ↓ 4.29% |
| Average Sale Price | $209,000 | $197,000 | ↑ 6.22% |
| Ask-to-Sell Ratio | 0.968 | 0.969 | ↓ 0.11% |
🔍 What This Means for Buyers
✅ More choices: Inventory is higher than last year, which means more units and more room to negotiate.
✅ Stable prices: No deep discounts, but room to negotiate on terms or closing dates.
✅ Faster process: Condos are still selling quicker than last year — be ready with pre-approval and a clear idea of what you want.
📌 Tip: Target newer buildings or well-managed condos for better long-term resale and lower maintenance risk.
💼 What This Means for Sellers
✅ Solid pricing: If you price your condo right, you can still get top dollar.
✅ Faster sales: The average days on market is decreasing — momentum is still there.
✅ More competition: Listings are up — make your property stand out with staging, marketing, and pro photography.
📌 Tip: Condos under $250K are especially hot with first-time buyers and investors — consider listing now to capture this demand.
🔮 Market Outlook: What’s Ahead for Q4?
As we enter the final quarter of 2025, the Edmonton condo market is expected to remain relatively balanced. While sales volumes may continue to be lower than last year, prices are projected to remain stable or trend slightly upward.
With interest rates stabilizing and demand from first-time buyers and investors continuing, the condo market should maintain its resilience into the winter.
📞 Ready to Buy or Sell Your Condo in Edmonton? Let’s Talk.
Whether you’re entering the market for the first time or considering selling your current condo, I’m here to help. With expert knowledge of Edmonton’s real estate trends, strong marketing tools, and a passion for helping clients succeed, I’ll guide you every step of the way.
📲 Call or text Chris Reid at (780) 717-5267
📍Century 21 Leading
Data provided by the REALTORS® Association of Edmonton and subject to change. Always consult with a real estate professional for the most current market information.
Are you considering buying or selling or just interested in more information on the condo real estate market in Edmonton? CONTACT ME HERE
City of Edmonton Website
Fort Saskatchewan Real Estate Market September 2025
As we move into the fall season, the Fort Saskatchewan real estate market is reflecting broader trends across Alberta — some stabilizing, some shifting. While the summer market brought solid growth and quicker sales, the September 2025 numbers show a recalibrating pace as the local market adjusts to interest rates, inventory levels, and seasonal slowdowns.
This detailed September 2025 Fort Saskatchewan real estate update explores the latest statistics and what they mean for both buyers and sellers. Whether you’re thinking of purchasing a home, listing a property, or investing in the community, this data-driven breakdown provides a comprehensive look at where the market stands — and where it’s headed.
📉 In September 2025 alone:
- Sold properties: 46 (↓ 37.84%)
- Average asking price: $493,000 (↑ 4.13%)
- Average sale price: $450,000 (↓ 4.24%)
- New listings: 75 (↓ 1.32%)
- Days on market: 49 (↑ 8.89%)
- Ask-to-sell ratio: 0.990 (↓ 0.23%)
Bar Graphs Below Are Interactive
Fort Saskatchewan New MLS® Listings
📥 New Listings: Inventory Tightens Slightly
Fort Saskatchewan saw 75 new listings in September 2025 — just 1.32% fewer than last year. Year-to-date, 749 properties have been listed, a 2.35% decline from 767 in 2024.
While these drops are modest, they contribute to a leaner inventory landscape. Fewer listings can intensify competition among buyers, especially in sought-after neighbourhoods. Sellers should still expect buyer interest, especially if their home is move-in ready and well-priced.
Fort Saskatchewan Average List Price
💵 Average Asking Price: A Surprising September Spike
In a twist from recent months, the average asking price in September 2025 rose to $493,000, up 4.13% year-over-year. This is a rare moment where seller expectations climbed despite sales volume falling.
While higher asking prices can reflect increased confidence from sellers, this surge may also be skewed by a greater share of higher-end homes entering the market. It’s important to note that year-to-date, the average asking price is still down 2.89%, sitting at $461,000.
For sellers, this underscores the importance of pricing based on active comparables — not just historical peaks. For buyers, it’s a reminder to look carefully at what features and locations justify premium pricing.
Fort Saskatchewan Home Sales
🏘️ Sold Properties: Sales Volume Slides in September
One of the most striking changes this month is the steep decline in the number of homes sold. September 2025 recorded only 46 sold properties, a 37.84% drop compared to the same month last year. Year-to-date, 575 homes have sold in 2025 — down 9.73% from 637 in 2024.
This decline could be attributed to a mix of seasonal slowdown, buyer fatigue, and higher borrowing costs. While summer often sees a flurry of activity, fall can usher in more caution among buyers, especially in a market where pricing trends are mixed and mortgage rates remain a factor.
Fort Saskatchewan Average Home Sale Price
💰 Average Sale Price: Monthly Dip, Annual Strength
The average sale price in September 2025 was $450,000, a 4.24% decrease from September 2024. However, year-to-date figures paint a more optimistic picture: the YTD average sale price is $463,000, up 4.62% over the same period last year.
What does this mean? While September may have seen more sales in the mid-range and fewer luxury transactions, the broader market has actually performed well in 2025. Buyers are still willing to pay for value, and well-maintained homes in desirable locations continue to command strong offers.
📊 Ask-to-Sell Ratio: Sellers Still Realizing Near-Full Value
September’s average ask-to-sell ratio was 0.990, meaning homes sold for 99% of their list price — a 0.23% drop from last year. While this may suggest slightly more negotiation power for buyers, the year-to-date ratio remains strong at 0.999, up 0.75% compared to 2024.
This shows that most sellers are still achieving close to what they’re asking, particularly if the property is well-prepared, appropriately priced, and marketed effectively.
Average Days on Market
⏱️ Days on Market: Slower Than Summer, Faster Than 2024
Homes took an average of 49 days to sell in September 2025, up 8.89% from the 45-day average in September 2024. This monthly increase is seasonal and not unexpected, as fall buyers tend to move more cautiously.
However, on a year-to-date basis, the average DOM is 45 days, which is 23.73% faster than last year. That’s a significant improvement and signals that when homes are priced correctly, they still move relatively quickly — even as the seasons shift.
📊 Market Snapshot – September 2025 at a Glance
| Metric | 2025 YTD | 2024 YTD | % Change |
| Sold Properties | 575 | 637 | ↓ 9.73% |
| Average Asking Price | $461,000 | $475,000 | ↓ 2.89% |
| New Listings | 749 | 767 | ↓ 2.35% |
| Days on Market | 45 | 59 | ↓ 23.73% |
| Average Sale Price | $463,000 | $442,000 | ↑ 4.62% |
| Ask-to-Sell Ratio | 0.999 | 0.992 | ↑ 0.75% |
🧠 What This Means for Buyers
While the market pace has moderated, buyers now have more time to think through their decisions. However, inventory remains slightly below last year’s levels, and well-priced homes are still selling relatively quickly.
Top buyer tips for September and Q4 2025:
- Stay pre-approved. Mortgage conditions are still changing, and rate holds can make a difference.
- Act decisively if you find the right home — properties in top shape are still getting attention.
- Look for opportunity in price adjustments. With sales volume down, some sellers may be more flexible.
🧠 What This Means for Sellers
Despite fewer overall sales in September, seller conditions remain favourable — particularly for move-in-ready homes in high-demand areas.
Top seller strategies for the fall market:
- Price strategically. Don't overreach based on the rising ask prices — align with comparable sold listings.
- Invest in presentation. Homes that are clean, decluttered, and staged continue to sell faster.
- Expect longer timelines. With DOM up slightly, plan your transition accordingly.
🔮 Market Forecast: A Balanced Fall Ahead
As we enter the final quarter of 2025, Fort Saskatchewan appears to be settling into a balanced market. Prices remain stable, but the cooling in sales volume indicates a more discerning buyer pool.
We expect:
- Continued strength in well-priced mid-range homes
- Slightly longer average days on market through October/November
- Price resilience heading into the winter, supported by limited inventory
Buyers will enjoy more breathing room, while sellers who remain flexible and strategic can still achieve strong outcomes.
📍 Why Fort Saskatchewan Remains a Smart Market
Fort Saskatchewan’s appeal continues to draw buyers from across the Edmonton region and beyond. With proximity to industrial job hubs, access to the river valley, and relatively affordable pricing compared to Edmonton and St. Albert, it remains one of Alberta’s most underrated places to buy.
Strong public amenities, local schools, and family-friendly neighbourhoods make it a long-term value market — whether you're buying your first home, upgrading, or investing.
📞 Ready to Make a Move?
Whether you're buying, selling, or simply exploring your options, navigating today's market takes local insight and strategic planning.
As a Fort Saskatchewan REALTOR® with a deep understanding of this evolving market, I can help you:
- Understand your home’s true market value
- Create a tailored pricing and marketing strategy
- Access upcoming listings before they hit the public MLS
- Negotiate the best deal possible — whether you’re buying or selling
📞 Call or text me today at (780) 717-5267
📧 Or email me at creid@chrisreidedmonton.com
Let’s talk about your real estate goals for fall 2025 and beyond.
Data provided by the REALTORS® Association of Edmonton and subject to change. Always consult with a real estate professional for the most current market information.
Are you considering buying or selling or just interested in more information on the real estate market in Fort Saskatchewan? CONTACT ME HERE
City of Fort Saskatchewan Website


St. Albert Real Estate Market Update: September 2025
As we move into the fall season, the St. Albert real estate market is showing strong resilience, renewed buyer confidence, and steady pricing stability despite national economic fluctuations. September historically marks a shift in buyer behaviour as families settle back into routines, serious buyers re-enter the market after summer travel, and motivated sellers list before winter. The September 2025 data reveals a market that is balanced yet active, fuelled by strong demand, moderate pricing, and increasing inventory—creating opportunities for both buyers and sellers.
This month’s report highlights an exceptional jump in sales activity, notable listing increases, and a stable pricing environment that signals long-term confidence in the St. Albert housing market. If you are planning to buy, sell, or invest in real estate, there has not been a better time in 2025 to enter the market.
If you'd like expert guidance tailored to your goals, contact Christina Reid, REALTOR® with Century 21 Leading, at (780) 717-5267—your local St. Albert market specialist.
📊 St. Albert September 2025 Market Highlights
| Metric | September 2025 | September 2024 | % Change (Monthly) |
| Sold Properties | 148 | 103 | +43.69% |
| Average Sale Price | $514,000 | $509,000 | +0.90% |
| Average Asking Price | $512,000 | $548,000 | -6.49% |
| New Listings | 190 | 150 | +26.67% |
| Days on Market | 39 days | 44 days | -11.36% |
| Ask-to-Sell Ratio | 0.999 | 1.000 | Slight decrease |
Despite a slight drop in list price, sales activity surged, inventory expanded, and homes sold faster than last year. Pricing remains stable—neither rising sharply nor declining—indicating balanced conditions and growing market confidence.


Bar Graphs Below Are Interactive
St. Albert New Listing Count
📦 Inventory Growth Offers More Choice
With new listings up 26.67% this month and 7.96% YTD, buyers now have more options. This increased choice is likely to draw more buyers off the sidelines before winter.
Average List Price
🏷️ Asking Prices Adjust Slightly, Attracting More Buyers
The average asking price decreased by 6.49% compared to last year, bringing more affordability into the market. This strategic pricing has stimulated buyer activity, resulting in properties selling faster and often very close to list price.
St. Albert Home Sales
📈 Sales Surge by 43.69%
A remarkable increase in sales indicates strong buyer demand returning to the market this fall. Many buyers who delayed their purchase over the summer due to travel or interest rate speculation have now returned—and they are ready to buy.
Average Sale Price of Homes
💵 Sale Prices Remain Stable and Up YTD
The monthly average sale price increased modestly by 0.90%, while year-to-date sale prices are up by an impressive 5.89%. This balance indicates healthy appreciation without volatility, ideal for both buyers (predictability) and sellers (equity growth).
Days on MLS®
📉 Days on Market Drop
Homes are selling 11.36% faster this September than last year and 22.45% faster year-to-date, demonstrating strong buyer motivation.
🔷 Year-to-Date Comparison – St. Albert Real Estate (January to September 2025)
| Metric | 2025 YTD | 2024 YTD | % Change (YTD) |
| Total Homes Sold | 1,211 | 1,213 | -0.16% |
| Average Sale Price | $529,000 | $499,000 | +5.89% |
| Average Asking Price | $557,000 | $536,000 | +3.91% |
| New Listings | 1,695 | 1,570 | +7.96% |
| Days on Market | 38 days | 49 days | -22.45% |
| Ask-to-Sell Ratio | 1.003 | 0.998 | +0.49% |
Even with a slight year-to-date decrease in the number of homes sold, pricing power remains strong and homes are selling significantly faster compared to last year—a sign of high demand and buyer urgency.
🌟 Opportunities for Buyers
Now is a highly strategic time to purchase in St. Albert:
✅ More Listings = Better Selection
With nearly 8% more listings available YTD, buyers have increased bargaining power in select property types.
✅ Prices Are Stable, Not Spiking
The market is no longer in aggressive bidding territory for most property types, making this a better environment for thoughtful buyers.
✅ Strong Long-Term Gains
With a year-to-date average sale price increase of nearly 6%, buyers can be confident they are entering a market with continued appreciation.
📞 Thinking about buying this fall? Let me help you find the right home at the right price.
Call or text me at (780) 717-5267.
🔑 Opportunities for Sellers
✅ Homes Are Selling Faster
Reduced days on market and strong sale prices indicate that well-priced homes still attract serious buyers quickly.
✅ Buyer Demand Is Re-Energized
The significant jump in sales means the pool of active buyers has grown entering the fall season.
✅ Pricing Strategy Matters More Than Ever
With the average asking price dropping while sale prices remain stable, strategic pricing and professional marketing are the keys to unlocking top dollar.
🎯 Want to know what your home could sell for in today's market?
Contact me for a free, no-obligation home valuation.
🔎 Community Spotlight: What’s Attracting Buyers to St. Albert?
St. Albert consistently ranks among the best places to live in Canada due to its:
- Top-tier public and Catholic schools
- Family-friendly amenities
- Low crime rate and strong community engagement
- Scenic trails, parks, and the Sturgeon River
- High resale value and long-term investment security
Neighbourhoods such as Jensen Lakes, Erin Ridge, Woodlands, North Ridge, and Oakmont continue to attract local and out-of-province buyers, especially those relocating for Alberta’s growing job market and affordability advantage.
🎯 What to Expect This Fall
As the market transitions into Q4:
- Sales activity is expected to remain strong
- Pricing will likely hold steady
- Inventory will tighten slightly as winter approaches
- Motivated buyers will act before interest rate updates
This creates an ideal window for both buyers seeking fair value and sellers aiming to capitalize on fall momentum.
🌐 Final Thoughts: A Market Worth Moving In
The September 2025 market data confirms that St. Albert remains one of Alberta’s most stable, high-performing real estate markets, combining affordability, lifestyle appeal, and strong long-term equity growth.
Whether you’re entering the market for the first time, upgrading, downsizing, or investing, timing is on your side—and working with a local expert ensures you’ll maximize your results.
📞 Your St. Albert Real Estate Expert
If you are considering buying or selling, I would love to help you navigate this exciting market with confidence and clarity.
Call or Text: (780) 717-5267
Email: creid@chrisreidedmonton.com
Brokerage: Century 21 Leading
Let’s turn today’s market trends into your real estate success story.
Data provided by the REALTORS® Association of Edmonton and subject to change. Always consult with a real estate professional for the most current market information.
Interested in buying or selling in the St. Albert real estate market CONTACT CHRIS REID
St. Albert Website
Edmonton Detached Single Family Home Market: September 2025 Update
As summer transitions into fall, the Edmonton real estate market for single-family homes remains active, albeit with shifting dynamics. September 2025 reflects a mixed market, characterized by steady listing activity, softened prices, and slightly reduced buyer urgency. For both buyers and sellers, this transitional period offers unique opportunities—especially for those with a well-informed strategy.
Let’s break down the numbers, analyze what’s happening behind the scenes, and explore what it means for your real estate decisions this fall.
📊 September 2025 Snapshot: Edmonton Single Family Home Metrics
Here are the key indicators from September 2025:
| Metric | September 2025 | Year-over-Year Change |
| Sold Properties | 780 | ▼ 1.89% |
| Average Asking Price | $617,000 | ▲ 3.11% |
| Average Sale Price | $531,000 | ▼ 1.45% |
| New Listings | 1,490 | ▲ 16.71% |
| Days on Market | 53 Days | No Change |
| Ask-to-Sell Ratio | 0.984 | ▼ 0.54% |
Interactive bar graphs
Edmonton New Single Family Home Listings
🏡 Listings Surge, Giving Buyers More Leverage
Inventory continues to increase with 1,490 new listings in September, a 16.71% jump from the same month last year. This brings the total number of new listings for 2025 to 13,300, up 12.21% year-over-year
.
Buyers now have a wider selection, reducing bidding wars and increasing negotiating power. More options mean less urgency and more time to compare, inspect, and analyze potential purchases.
For sellers, this surge in competition underscores the importance of strategic pricing, professional presentation, and marketing exposure to stand out in a more crowded marketplace.
Average Asking Price
💰 Asking Prices Up
The average asking price in September 2025 rose to $617,000, up 3.11% year-over-year. This continued increase signals that seller expectations remain optimistic heading into the fall
Edmonton Single Family Home Sales
🏘️ Sales Volume Softens as Market Balances
The number of single-family homes sold in September fell to 780, representing a 1.89% decline compared to September 2024. On a year-to-date basis, 7,862 homes have sold, down 5.00% from the 8,276 properties sold by this time last year
This reduction reflects a moderating market that’s adjusting to higher price points, changing seasonal dynamics, and a more informed and selective buyer pool. However, this shift doesn’t signal weakness—instead, it marks the return of a more balanced and stable housing landscape where thoughtful offers are becoming the norm.
Average Single Family Home Sale Price
💰 Sale Prices Slide in September
The average sale price dipped slightly to $531,000, a 1.45% decline compared to September 2024. This indicates that while sellers are listing higher, buyers are more price-conscious and negotiating accordingly.
On a YTD basis, however, the average sale price sits at $557,000, still up 6.26% from last year. This suggests that while September saw a bit of softening, overall home values continue to trend upward in 2025
🔄 Ask-to-Sell Ratio Declines Slightly
The average ask-to-sell ratio for September 2025 dropped to 0.984, down 0.54% from last year. This means that homes are selling for about 98.4% of their asking price, compared to a full or near-full price in previous months
Year-to-date, the ratio remains relatively stable at 0.994, indicating that serious buyers are still willing to meet seller expectations—provided the pricing is aligned with comparable market activity.
Days on MLS®
⏳ Days on Market Hold Steady
In September 2025, the average days on market remained at 53 days, unchanged from the previous year. Year-to-date, however, homes are selling in an average of 48 days, which is a significant improvement over 54 days during the same period in 2024—a reduction of 11.11%
This indicates that, while September brought a seasonal slowdown, homes that are priced and presented well are still moving faster than in previous years.
Year-to-Date (YTD) Summary:
| Metric | 2025 YTD | 2024 YTD | % Change |
| Sold Properties | 7,862 | 8,276 | ▼ 5.00% |
| Average Asking Price | $617,000 | $593,000 | ▲ 4.02% |
| Average Sale Price | $557,000 | $524,000 | ▲ 6.26% |
| New Listings | 13,300 | 11,900 | ▲ 12.21% |
| Days on Market | 48 | 54 | ▼ 11.11% |
| Ask-to-Sell Ratio | 0.994 | 0.994 | ▲ 0.03% |
🔍 Market Interpretation: What the Numbers Say
The September 2025 data points to a balanced but shifting market:
- Sellers are still enjoying strong pricing, especially for well-maintained homes in desirable neighbourhoods.
- Buyers have more listings to choose from, slightly more time to act, and modest negotiating power.
- Overall, the market is in a healthier state than in previous years, offering stability instead of volatility.
🧠 What This Means for Buyers
With increased inventory and slightly softening sale prices, September was a favourable time for buyers in Edmonton. Here's what this means if you're still in the market:
✅ Advantages:
- More inventory to choose from
- Slightly lower sale prices
- Stabilized days on market = less pressure to rush
⚠️ Considerations:
- Strong listings still sell quickly
- Some sellers may hold firm on prices due to YTD gains
Buyer Tips:
- Work with a REALTOR® to identify motivated sellers
- Be ready to negotiate from a position of strength
- Get pre-approved to act quickly when the right opportunity appears
💼 What This Means for Sellers
If you're a seller, don't be discouraged by softening sale prices in September—average values are still up YTD, and homes continue to move at a good pace. Here’s how to stay competitive:
✅ Advantages:
- Strong YTD average sale price
- Homes still selling in under two months
- More serious fall buyers
⚠️ Considerations:
- More listings = more competition
- Buyers expect value and may negotiate harder
Seller Tips:
- Price correctly from the start
- Invest in staging and photography
- Ensure your home is move-in ready to maximize buyer interest
🏘️ Neighbourhoods Showing Strong Activity
Some Edmonton neighbourhoods continue to perform well in terms of pricing and turnover. If you're buying or selling in these areas, expect more competition:
- Windermere & Keswick: High demand continues for luxury and new-build homes
- Glenridding & Edgemont: Excellent for move-up buyers
- Secord & Rosenthal: Strong family demand and community amenities
- Griesbach: Consistently one of the city's top-performing infill communities
🔮 Looking Ahead to Fall and Winter 2025
As we enter the final quarter of the year, here’s what we anticipate:
- Listings may slow down seasonally, reducing buyer options
- Sale prices may stabilize further as demand softens
- Serious buyers and motivated sellers will dominate the market
Expect a more measured pace in Q4, with strategic timing and strong REALTOR® representation becoming even more important.
📞 Ready to Make a Move? Let’s Talk
Whether you’re looking to buy, sell, invest, or simply learn more about your neighbourhood’s market, I’m here to help you navigate Edmonton real estate with confidence.
📱 Call/Text: 780-717-5267
📧 Email: creid@chrisreidedmonton.com
🌐 Website: chrisreidedmonton.com
Let’s build a smart real estate plan together—one that fits your life and your goals.
Data provided by the REALTORS® Association of Edmonton and subject to change. Always consult with a real estate professional for the most current market information.
If you would like more information on buying and selling single family homes in Edmonton CONTACT CHRIS REID
City of Edmonton Website
Parkland County Acreage Market Overview: September 2025
September 2025 brought a powerful resurgence in acreage sales across Parkland County. Despite fewer new listings and a drop in asking prices, the market surged ahead with strong sales activity, higher sale prices, and faster closings. Whether you're a buyer eyeing rural life or a seller considering listing your acreage, understanding these trends can help you make a smart move in today’s evolving market.
📊 September 2025 At a Glance
| Metric | Sep 2025 | Sep 2024 | % Change |
| Sold Properties | 68 | 50 | ↑ 36.00% |
| Average Asking Price | $750,000 | $849,000 | ↓ 11.60% |
| Average Sale Price | $701,000 | $566,500 | ↑ 23.74% |
| New Listings | 64 | 100 | ↓ 36.00% |
| Days on Market | 75 days | 147 days | ↓ 48.98% |
| Ask-to-Sell Ratio | 0.977 | 0.971 | ↑ 0.65% |


Below Graphs Are Interactive
Parkland County Acreage Listings
🏘️ New Listings Fall 36% – Less Inventory, More Demand
Only 64 new acreage listings hit the market in September 2025, a steep 36% decline compared to the same time last year
. Year-to-date, new listings remain steady at 834, just slightly down (0.24%) from 2024.
Fewer new listings paired with more sales mean reduced inventory, which could tighten the market further heading into the fall.
For Sellers:
- Now is the time to list. With fewer competing properties and strong buyer demand, well-priced acreages are receiving attention quickly.
For Buyers:
- Be ready to act fast. With limited options available and faster sales, it’s critical to have financing in place and work with an agent who can alert you to new opportunities quickly.
Average List Price
📉 Asking Prices Adjust Downward
In a notable shift, the average asking price in September 2025 dropped to $750,000, a 11.6% decrease year-over-year
. This is the lowest average asking price reported in several months, possibly reflecting seller recognition of evolving buyer expectations or increased motivation to sell before winter.
However, the year-to-date asking price remains higher than last year overall, with a modest 0.63% decrease, sitting at $731,000 compared to $736,000 in 2024
This gap between list price and sale price continues to narrow, especially with an ask-to-sell ratio of 0.977, meaning most properties sold for 97.7% of their asking price in September.
Parkland County Acreage Sales
🔼 Sales Surge: 36% More Acreages Sold
In September, 68 acreage properties were sold across rural Parkland County, a significant 36% increase over the same month last year
. Year-to-date, 2025 has seen 507 total sales, up 10.7% compared to 2024
This growth in activity confirms that buyer confidence in rural property continues to strengthen—likely driven by demand for space, lifestyle flexibility, and proximity to nature while staying within reach of Edmonton and surrounding communities.
Parkland County Average Sale Price
💰 Average Sale Price Soars to $701K
Despite a drop in average asking price, the average sale price climbed 23.74% from the previous year, reaching $701,000 in September. This is a clear sign that well-presented acreages are attracting strong offers—even in a tightening market.
Why This Matters:
- Sellers are still getting great value when pricing correctly.
- Buyers are willing to pay top dollar for move-in-ready homes, well-serviced land, or desirable locations near Spruce Grove, Stony Plain, or major commuting routes.
Year-to-date, the average sale price across Parkland County acreages sits at $649,000, a 3.16% increase over 2024
Average Days on MLS®
⏳ Time on Market Drops Significantly
The average days on market fell to just 75 days in September, a 48.98% drop from the 147-day average in 2024
. Year-to-date, acreage properties are selling 18.25% faster, averaging 103 days on market in 2025 vs. 126 in 2024.
This indicates:
- Buyers are moving quickly once they find the right property.
- Sellers are pricing smarter and preparing their homes more effectively for sale.
If you’re listing your acreage, now is the time to act—homes are turning over faster than they were a year ago.
🧭 YTD Market Summary – January to September 2025
Parkland County’s acreage market continues to show healthy appreciation, consistent sales activity, and fast-moving inventory.
- 507 properties sold (↑ 10.70%)
- Average sale price: $649K (↑ 3.16%)
- Average asking price: $731K (↓ 0.63%)
- Average days on market: 103 (↓ 18.25%)
- Ask-to-sell ratio: 0.976 (↑ 0.40%)68f63118-a4e474357409fecd5b8b1b…
This balance of price growth, quicker sales, and tight inventory reflects a stable yet competitive rural market that continues to attract lifestyle buyers and long-term investors alike.
📝 Final Thoughts
September’s market data confirms what we’ve seen all year: Parkland County’s acreage market is thriving. With strong buyer demand, low days on market, and increasing sale prices, sellers are in a favourable position. At the same time, buyers who act quickly and stay informed can still find excellent opportunities to purchase acreage properties in a highly desirable location.
📞 Ready to Make a Move?
Whether you're buying or selling, now is a great time to explore your options in Parkland County’s acreage market.
👩💼 Christina Reid – REALTOR®
📱 (780) 717-5267
📧 creid@chrisreidedmonton.com
Let’s talk about your goals, evaluate your property, or find you the perfect piece of land to call home.
Data provided by the REALTORS® Association of Edmonton and subject to change. Always consult with a real estate professional for the most current market information.
If you would like more information on buying and selling in Parkland County CONTACT CHRIS REID


Edmonton Real Estate Market Update – September 2025
As summer fades and fall begins, the Edmonton real estate market continues to show strength, adaptability, and ongoing demand despite seasonal shifts. September 2025 has brought a mixture of price growth, active listings, and steady buyer interest, setting the stage for a balanced finish to Q3 and a potentially strong Q4. Whether you’re a home buyer, home seller, or real estate investor, understanding the nuances of the current market is key to making informed decisions.
Let’s take a deep dive into the numbers, trends, and opportunities presented in this month's market update, based on the latest data from the REALTORS® Association of Edmonton.
📊 Year-to-Date (YTD) Comparison: 2025 vs. 2024
To offer context to this month’s numbers, we’ve compiled a side-by-side comparison of YTD statistics through the end of September 2025, compared to the same period in 2024:
| Metric | 2025 YTD | 2024 YTD | % Change |
| Total Sales | 15,296 | 14,419 | ↑ 6.08% |
| New Listings | 26,317 | 25,153 | ↑ 4.63% |
| Average Sale Price | $409,273 | $389,432 | ↑ 5.10% |
| Average List Price | $418,630 | $399,451 | ↑ 4.80% |
| Days on Market | 40 | 47 | ↓ 14.89% |
| List-to-Sale Ratio | 97.8% | 97.5% | ↑ 0.31% |
These numbers highlight a stronger, faster-moving market in 2025 with continued price appreciation and an increase in overall activity.


Below Graphs Are Interactive.
Edmonton New MLS® Listings
🏘️ New Listings on the Rise
September brought 2,799 new listings to market in Edmonton, a 9.3% increase from August 2025 and a 3.7% increase year-over-year. This is good news for buyers who have been facing limited options over the past few months. An increase in inventory is helping to stabilize competition, especially in desirable neighbourhoods.
From a seller’s perspective, the rise in listings offers a window of opportunity before winter arrives. Homes listed in September and October tend to see strong interest from serious buyers looking to move before year-end.
Average List Price Edmonton Real Estate Market
💰 Average List Price
The average list price in Edmonton for September 2025 came in at $417,100, reflecting an increase of 4.2% compared to September 2024. This upward trend shows that sellers are becoming more confident in the market's value, and the appreciation in list price is supported by consistent sales volumes.
In particular, single-family homes and townhouses continue to drive list price increases, as demand for multi-bedroom, move-in-ready homes with modern amenities remains high.
Home Sales In The Edmonton Real Estate Market
🏡 Total Residential Sales
In September 2025, 1,825 residential properties were sold across the Greater Edmonton Area (GEA), which represents a 25.3% increase year-over-year compared to September 2024. Month-over-month, sales were slightly down by 8.4% from August 2025, which is typical for this time of year as families settle into the back-to-school routine and seasonal patterns begin to shift.
Despite this expected seasonal dip, sales volume has remained consistently stronger in 2025 than in 2024, signalling continued buyer demand and market confidence, especially in single-family homes and townhouses.
Edmonton Average Home Sale Price
💸 Average Sale Price
The average sale price across all property types in Edmonton reached $406,000 in September 2025. This figure represents a 3.2% year-over-year increase, and while slightly down from the August average, it's a healthy sign of sustainable price growth.
Let’s break it down by property type:
- Single-Family Detached Homes: $507,396 (↑ 4.1% year-over-year)
- Semi-Detached Homes: $386,185 (↑ 6.3% year-over-year)
- Row/Townhouses: $276,048 (↑ 9.4% year-over-year)
- Apartment Condominiums: $194,013 (↓ 1.4% year-over-year)
Townhouses and semi-detached homes have seen the strongest price appreciation, likely due to their affordability and popularity with first-time buyers, downsizers, and investors. Meanwhile, apartment condos remain the most affordable entry point into Edmonton’s housing market, even as prices flatten slightly.
📈 List-to-Sale Price Ratio
The list-to-sale price ratio held steady at 97.3% in September 2025, meaning homes are selling on average just 2.7% below their asking price. This is slightly improved from the 97.0% ratio reported in September 2024.
This ratio signals that there’s less room for negotiation than in previous years—a good sign for sellers—while still leaving space for buyers to negotiate on terms or closing dates.
Edmonton Real Estate Market -Average Days
⏳ Days on Market
In September, Edmonton homes spent an average of 42 days on the market, compared to 48 days in September 2024—a reduction of 12.5% year-over-year. This reflects faster sales and stronger buyer urgency, especially for well-presented and accurately priced properties.
Lower days on market are generally considered a sign of a healthy, competitive real estate environment. Buyers are acting more decisively, and sellers who price correctly are reaping the rewards.
🧱 Inventory & Market Balance
At the end of September, Edmonton had 6,885 active listings, which represents a month-over-month increase of 2.8%. The market remains relatively balanced, with about 3.8 months of supply. This means that if no new listings were added, it would take 3.8 months to sell the current inventory based on current demand.
A balanced market benefits both buyers and sellers. Buyers have a bit more time to shop and negotiate, while sellers still see solid returns when homes are staged and priced competitively.
🔍 What This Means for Buyers
If you’re a home buyer in Edmonton, the market remains competitive but fair. Interest rates remain steady, and with increasing inventory levels, you may have more options this fall than earlier in the year.
However, don’t wait too long—especially in the under $500,000 price range, homes are still moving fast. Townhouses and semi-detached properties in newer communities like Secord, Chappelle, and McConachie are particularly popular with first-time buyers and young families.
Consider getting pre-approved and working with an experienced agent (like me!) to gain access to new listings quickly and act confidently when the right property comes up.
💼 What This Means for Sellers
Sellers continue to benefit from strong market fundamentals. With low days on market and a strong list-to-sale ratio, this fall could be the ideal time to list your home.
- Staging, photography, and accurate pricing are crucial in achieving top dollar.
- Homes under $600,000 remain in highest demand, especially those that are turnkey or recently renovated.
- Detached homes in established neighbourhoods like Glenora, Capilano, and Terwillegar Towne continue to outperform in terms of days on market and sale price.
If you're unsure whether to list now or wait until spring, reach out and I can provide you with a personalized market analysis tailored to your home and neighbourhood.
📣 Final Thoughts: Steady Growth, Strong Fundamentals
September 2025 reflects a confident, stable real estate market in Edmonton. With continued price growth, faster sales, and rising inventory, both buyers and sellers have opportunities to succeed heading into the fall season.
Whether you're moving up, downsizing, relocating to Alberta, or investing in new construction, the numbers show that Edmonton remains one of Canada’s most affordable, high-value cities to live and invest in.
📞 Let’s Talk Real Estate!
If you're thinking about buying or selling in Edmonton this fall, let’s chat! I specialize in:
- 🏡 First-time home buyers
- 🔑 New construction and quick-possession homes
- 🌳 Acreage and estate properties
- 🏢 Investment and multi-family real estate
Call or text me directly at (780) 717‑5267 or click here to schedule a consultation.
Your Edmonton real estate goals are just one conversation away!
Data provided by the REALTORS® Association of Edmonton and subject to change. Always consult with a real estate professional for the most current market information.
Looking to buy or sell in Edmonton? CONTACT CHRIS REID
City of Edmonton Website
Spruce Grove Real Estate Market Update September 2025
As we move into the crisp days of fall, the Spruce Grove real estate market is beginning to show signs of seasonal moderation. With fewer properties sold, longer days on market, and a softening in sale price growth, the September 2025 statistics reflect a shift toward a more balanced market—creating different opportunities for buyers and sellers alike.
If you’re considering a move in Spruce Grove, this in-depth update will help you understand what the numbers mean, and how to navigate this evolving market landscape.
📊 September 2025 At-a-Glance: Spruce Grove Housing Stats
| Metric | September 2025 | September 2024 | % Change |
| Sold Properties | 89 | 98 | ↓ 9.18% |
| YTD Sold Properties | 921 | 1010 | ↓ 8.81% |
| Average Asking Price | $501,000 | $471,500 (approx.) | ↑ 6.26% |
| YTD Avg Asking Price | $503,000 | $461,000 | ↑ 9.00% |
| Average Sale Price | $461,000 | $456,400 (approx.) | ↑ 1.01% |
| YTD Avg Sale Price | $475,000 | $430,000 | ↑ 10.67% |
| New Listings | 130 | 132 | ↓ 1.52% |
| YTD New Listings | 1308 | 1251 | ↑ 4.56% |
| Days on Market | 63 days | 48 days (approx.) | ↑ 31.25% |
| Ask-to-Sell Ratio | 0.990 | 0.999 (approx.) | ↓ 0.86% |


The below graphs are interactive
New MLS® Listing Count
📦 New Listings: A Slight Dip, But Inventory Remains Strong
In September 2025, 130 new properties hit the market in Spruce Grove, which is a 1.52% decrease compared to September 2024.
While this month saw a modest drop in listings, the year-to-date total has climbed to 1,308 homes listed, representing a 4.56% increase over last year’s 1,251 listings at the same point in time.
This year-over-year growth in overall inventory provides continued support for buyers entering the fall market. Although September's listings dipped slightly, this could be attributed to seasonal patterns where fewer homeowners list homes in the fall. Still, the broader trend shows that more sellers are entering the market in 2025, helping ease pressure on supply and offering buyers more choice heading into Q4.
Average Listing Price in Spruce Grove
📈 Average Asking Price: Seller Confidence Still Holding
The average asking price in September 2025 was $501,000, showing a 6.26% increase from the same month last year. The year-to-date average asking price holds strong at $503,000, up 9.00% compared to 2024.
This consistent rise in list prices demonstrates continued seller confidence, even as the market shows signs of slowing in terms of actual sales. Many homeowners are still aiming to capitalize on the gains seen earlier in the year. However, as buyer caution grows and days on market lengthen, pricing homes appropriately from the start will be crucial. Sellers hoping to stand out in the increasingly competitive fall market will benefit from accurate valuations and expert local insight.
Spruce Grove Home Sales
🏠 Sales Activity: Slowing into Fall
In September 2025, 89 properties sold in Spruce Grove—down from 98 in the same month last year. This represents a 9.18% drop in sales, aligning with the seasonal cooling we often see as summer turns to fall.
Looking at the bigger picture, the year-to-date total of 921 sales is 8.81% lower than 2024's YTD figure of 1,010 homes sold
While this might seem like a concern at first glance, it’s a normal transition in many markets as buyer urgency tends to taper off in the autumn months. For sellers, this means pricing right and marketing effectively is more important than ever.
Real Estate Market Statistics Spruce Grove Average Home Sale Price
This shows that sellers remain confident, although the rate of price growth is starting to slow compared to the double-digit jumps we saw earlier in the year.
Sale Prices:
- The average sale price in September came in at $461,000, just 1.01% higher than the same month in 2024.
- Year-to-date, homes in Spruce Grove have sold for an average of $475,000, a 10.67% increase from last year.
.
The narrowing gap between list price growth and sale price growth suggests buyers are becoming more price-sensitive, especially as affordability is tested.
🧾 Ask-to-Sell Ratio: Buyers Gaining Leverage
The ask-to-sell ratio in September was 0.990, a slight drop of 0.86% from the previous year, and a sign that homes are no longer selling at or above list price as frequently as they were in the spring and summer
This doesn’t mean the market has turned negative—it simply indicates that buyers are being more selective and negotiations are back on the table.
Days on Market Until Sale
📉 Days on Market: Properties Taking Longer to Sell
One of the most notable changes in September is how long homes are staying on the market.
- The average number of days on market jumped to 63 days, a 31.25% increase from last year.
- Even so, the YTD average sits at 50 days, still 15.25% faster than 2024's pace
This monthly increase is a strong indicator that demand is softening slightly—buyers may be taking more time to make decisions, especially with more listings available.
📊 Spruce Grove Real Estate – Year-to-Date Comparison (2025 vs. 2024)
| Metric | 2025 YTD | 2024 YTD | % Change |
|---|---|---|---|
| Sold Properties | 921 | 1010 | ↓ 8.81% |
| Average Asking Price | $503,000 | $461,000 | ↑ 9.00% |
| Average Sale Price | $475,000 | $430,000 | ↑ 10.67% |
| New Listings | 1,308 | 1,251 | ↑ 4.56% |
| Days on Market | 50 | 59 | ↓ 15.25% |
| Ask-to-Sell Ratio | 1.000 | 0.995 | ↑ 0.56% |
🧭 What This Means for Buyers
If you're a buyer, fall 2025 could be your sweet spot.
- More choices: Inventory remains high with 1,308 new listings year-to-date.
- Less competition: With fewer bidding wars and longer days on market, you may be able to negotiate better terms.
- Stabilizing prices: Sale prices are no longer rising rapidly, which helps buyers make more confident, long-term decisions.
👋 If you’re thinking about buying in Spruce Grove this fall, let’s talk about your goals and how we can find the perfect property together. Call me, Christina Reid, at (780) 717-5267 for personalized guidance.
💡 What This Means for Sellers
Sellers can still do well—but strategic preparation and accurate pricing are more critical than ever.
- Homes are still selling—but it’s taking longer and buyers are less likely to offer over asking.
- Presentation matters: Staging, professional photography, and strong marketing will make your home stand out in a growing inventory pool.
- Price smart: Look at recent comparable sales, not just list prices.
🎯 Want a custom market evaluation of your home? Reach out to me at (780) 717-5267 and I’ll provide you with a pricing strategy that works in today’s conditions.
🌇 Why Spruce Grove Continues to Be a Desirable Market
Even as the market shifts, Spruce Grove remains a top destination for homeowners across the Edmonton region.
🚗 Easy Commute
With direct access to Yellowhead Trail (Highway 16) and just 20–30 minutes to downtown Edmonton, Spruce Grove is ideal for professionals who want suburban peace without long commutes.
🏡 Family-Oriented Neighbourhoods
Communities like Prescott, McLaughlin, Greenbury, and Fenwyck offer modern homes, great schools, and family-friendly amenities.
🌿 Outdoor Lifestyle
With miles of walking trails, the Tri-Leisure Centre, and nearby golf courses, it’s easy to enjoy an active lifestyle here.
🛍️ Shopping & Services
Spruce Grove offers big-box retail, boutique shops, restaurants, and healthcare—all while maintaining small-town charm.
🔮 Looking Ahead: Fall & Winter 2025
Here’s what we might expect heading into the end of 2025:
- Inventory will remain steady: New listings may slow slightly, but enough options should remain for buyers through winter.
- Sales may decline seasonally, but sellers who prepare their homes well can still see solid results.
- Prices may hold, but we’re unlikely to see the dramatic gains from earlier this year continue at the same pace.
It’s a market in transition, and that creates opportunities for both buyers and sellers who are strategic.
📞 Work with a Local Expert – Christina Reid
Whether you're buying your first home, investing, downsizing, or upgrading—navigating today’s market requires local expertise and smart strategy.
I’m here to help you make sense of the data and turn it into results.
📱 Call or text me anytime at (780) 717-5267
📧 Email: creid@chrisreidedmonton.com
🌐 Visit: chrisreidedmonton.com
For more information on buying or selling in Spruce Grove CONTACT CHRIS REID
Data provided by the REALTORS® Association of Edmonton and subject to change. Always consult with a real estate professional for the most current market information.
City of Spruce Grove Website
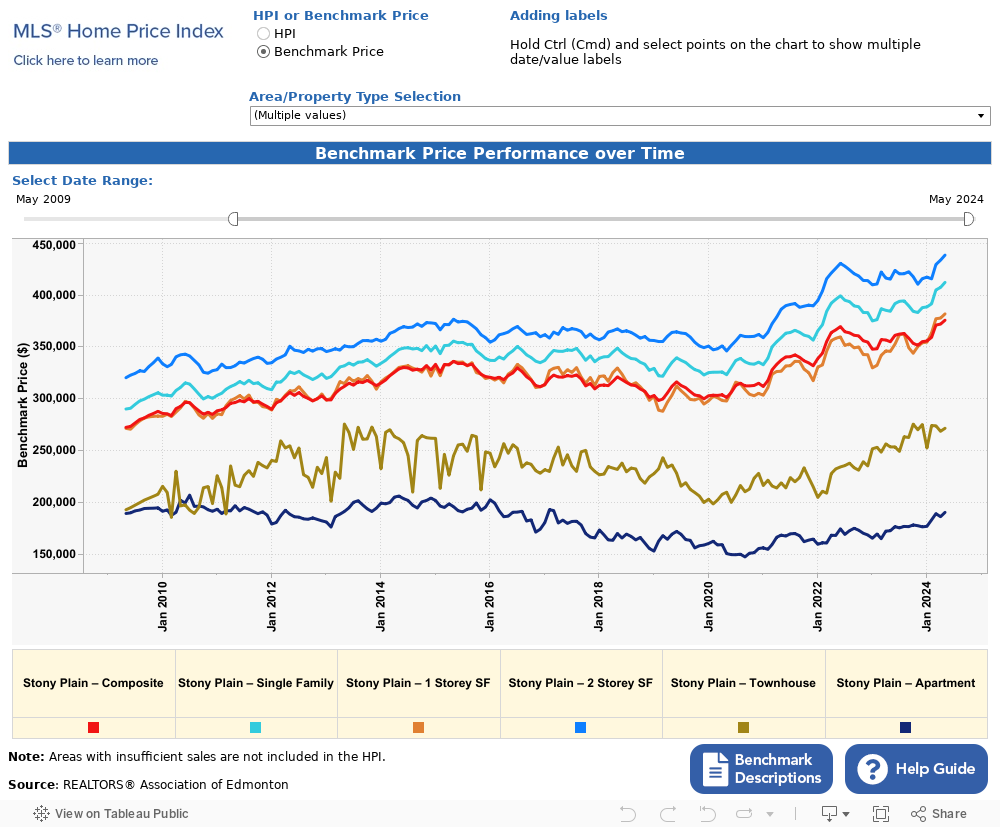
Stony Plain Real Estate Market Update: September 2025
As we step into the final quarter of the year, the Stony Plain real estate market continues to offer valuable insight for homeowners, prospective buyers, and investors. September 2025 showed a stable level of sales activity but revealed some notable shifts in pricing, days on market, and inventory that are well worth watching.
Whether you're a homeowner curious about your property's value, a buyer looking for the right opportunity, or an investor tracking trends, this report provides a full breakdown of the Stony Plain real estate market for September 2025—from price growth to listing activity and everything in between.
📊 Stony Plain September 2025 Snapshot
| Metric | September 2025 | September 2024 | % Change |
| Sold Properties | 34 | 34 | 0.00% |
| YTD Sold Properties | 364 | 393 | -7.38% |
| Average Asking Price | $460,000 | $370,400 (est.) | +24.19% |
| YTD Average Asking Price | $434,000 | $407,000 | +6.63% |
| New Listings | 43 | 58 (est.) | -25.86% |
| YTD New Listings | 481 | 491 | -2.04% |
| Average Sale Price | $421,000 | $349,000 (est.) | +20.63% |
| YTD Average Sale Price | $407,000 | $383,000 | +6.25% |
| Average Days on Market | 35 | 42 | -16.67% |
| YTD Days on Market | 45 | 53 | -15.09% |
| Ask to Sell Ratio | 98.5% | 99.1% | -0.64% |
| YTD Ask to Sell Ratio | 99.2% | 99.0% | +0.17% |
Below Graphs Are Interactive
Stony Plain Real Estate - New MLS® Listings
🏡 New Listings Drop Sharply
September 2025 brought 43 new listings to market, which is a 25.86% decrease compared to September 2024. Year-to-date, 481 new homes have been listed, a 2.04% decrease from 2024 levels.
This drop in fresh inventory is a double-edged sword:
- For sellers, it’s an opportunity to stand out in a less crowded market.
- For buyers, it means fewer options and potentially increased competition for desirable
Average Asking Price of Homes in Stony Plain
🏷️ Asking Prices Hit New Highs
In September, the average asking price climbed to $460,000, a staggering 24.19% year-over-year increase. That’s one of the steepest annual jumps in listing prices we’ve seen all year.
With a YTD average asking price of $434,000, up 6.63% from 2024, sellers are clearly pricing high—and for good reason. With sale prices also on the rise, sellers are seeing favourable returns, although overpricing can still hurt if a home lingers on the market too long
Stony Plain Home Sales
🏘️ Sales Hold Steady Despite Economic Headwinds
September saw 34 homes sold, exactly matching the number sold in the same month last year. On the surface, this may suggest stability, but when looking at year-to-date (YTD) sales, we see a 7.38% decline, with 364 homes sold so far in 2025 compared to 393 by this time in 2024
While this drop is moderate, it may reflect rising borrowing costs, affordability challenges, or simple buyer hesitancy heading into the fall. That said, consistent monthly activity suggests continued local demand and overall market resilience.
Stony Plain Real Estate Market- Average Home Sale Price
💰 Sale Prices Surge in September
One of the most striking changes in the market is the jump in average sale price, which reached $421,000 in September 2025. That’s a 20.63% increase over September 2024. This strong appreciation continues a trend of rising property values in Stony Plain.
YTD, the average sale price now sits at $407,000, up 6.25% from the same time last year
These figures make it clear: Stony Plain remains a strong market for long-term homeowners and sellers looking to build equity.
📉 Slight Dip in Ask-to-Sell Ratio
The ask-to-sell ratio in September dropped slightly to 98.5%, from approximately 99.1% in the previous year. This means that homes are still selling close to asking price, but not quite at the same premium levels we saw in the past.
However, YTD the ratio remains strong at 99.2%, demonstrating that realistic pricing is still rewarded with serious offers near asking
Stony Plain Average Days on Market
⏳ Homes Selling Faster Than Before
Another favourable trend is the reduction in days on market. The average time to sell a home in Stony Plain dropped to 35 days in September, down 16.67% from a year ago. YTD, homes are selling in about 45 days on average, an improvement over 53 days in 2024.
This means that while listings are lower, the homes that are on the market are selling faster—likely due to increased pricing confidence and better-prepared listings
🧭 What This Means for Buyers
- Higher Prices Mean Acting Quickly Is Critical
With sale prices climbing nearly 21% year-over-year, buyers should be aware that hesitation may lead to paying more later. - Tighter Inventory Means More Competition
A 25% drop in new listings means fewer choices. Be prepared to move fast and work with a local expert to identify new listings the moment they hit the market. - Quick Closings Are the Norm
With homes selling in just over a month, buyers should have pre-approvals in hand and be ready to make decisive offers.
🏠 What This Means for Sellers
-
- It’s a Seller’s Market—Still
Despite the slowdown in total sales, rising prices and faster sales mean sellers are in a favourable position, especially for well-maintained homes in desirable price ranges. - Fewer Listings Mean More Exposure
With fewer homes on the market, properly marketed listings stand out, often attracting more attention and potentially multiple offers.
- It’s a Seller’s Market—Still
momentum.
- Strategic Pricing Matters
While asking prices are up, the small dip in the ask-to-sell ratio shows that buyers are negotiating. Price too high, and you risk losing valuable early
🏙️ Why Buyers Continue to Choose Stony PlainWith its welcoming community atmosphere, proximity to Edmonton, and steadily growing amenities, Stony Plain continues to be a popular choice for:- First-time buyers looking for value
- Families seeking space and schools
- Retirees downsizing without sacrificing lifestyle
- Investors betting on long-term appreciation in a stable market
🔮 Market Outlook for Fall 2025
Looking ahead into the fall, here are some trends to watch:
- Interest Rates & Affordability
If rates remain steady, demand is likely to stay high even as we move into a typically slower season. - Inventory Levels
With new listings declining, buyers will need to act quickly—and sellers may face less competition. - Continued Price Growth
The trend line shows steady appreciation. If you’ve been waiting to sell, the fall season could offer you optimal conditions.
📞 Thinking About Buying or Selling in Stony Plain? Let’s Talk.
Whether you’re a seller hoping to capitalize on the market or a buyer looking to make a smart investment, I can help you navigate the process with confidence.
I’m Chris Reid, REALTOR® with Century 21 Leading.
📱 Call or Text: (780) 717-5267
📧 Email: creid@chrisreidedmonton.comLet’s make your next move your best one yet.
Data provided by the REALTORS® Association of Edmonton and subject to change. Always consult with a real estate professional for the most current market information.
If you are considering buying or selling a home in Stony Plain or just want more information on the Stony Plain real estate market, CONTACT ME HERE.
Rural Strathcona County Real Estate Market Update – September 2025
Acreage Market Growth Continues in Strathcona County Amid Late-Summer Shifts
As we head into fall, the rural real estate landscape in Strathcona County continues to evolve, with key trends emerging that impact both buyers and sellers. With rolling farmland, private estates, and proximity to Sherwood Park and Edmonton, this area remains a sought-after destination for those seeking space, lifestyle, and long-term value.
The latest stats from the REALTORS® Association of Edmonton show a dynamic market marked by higher transaction volume, slower turnover, and slight shifts in pricing. In this blog, we unpack the numbers from September 2025 and offer actionable insights for buyers, sellers, and investors.
📊 Market Summary – September 2025
Here’s how the market performed last month in rural Strathcona County:
| Metric | September 2025 | September 2024 | % Change |
| Sold Properties | 38 | 31 | +22.58% |
| YTD Sold Properties | 330 | 289 | +14.19% |
| Average Sale Price | $770,000 | $788,000 | -2.30% |
| YTD Avg. Sale Price | $841,000 | $756,000 | +11.27% |
| Average Asking Price | $934,000 | $1,059,000 | -11.76% |
| YTD Avg. Asking Price | $976,000 | $908,000 | +7.46% |
| New Listings | 46 | 49 | -6.12% |
| YTD New Listings | 505 | 529 | -4.54% |
| Avg. Days on Market | 95 | 76 | +25.00% |
| Ask-to-Sell Ratio | 0.969 | 0.958 | +1.15% |
| YTD Ask-to-Sell Ratio | 0.979 | 0.966 | +1.33% |
Bar graphs below are interactive
Strathcona County -Acreage Listings
📥 New Listings: Inventory Tightening into Fall
Only 46 new listings hit the market in September—a 6.12% drop from last year. Even more telling, year-to-date new listings are down 4.54%, with only 505 properties listed in total so far this year
Takeaway:
Buyers will continue to feel pressure due to shrinking inventory. This also helps sellers maintain negotiating power—particularly those who are listing competitively.
If you’re a buyer: be proactive and act fast.
If you’re a seller: this is an excellent window to list before winter inventory dwindles even further.
Strathcona County - Average Acreage List Price
📈 Asking Prices: Sellers Temper Expectations
The average asking price in September was $934,000, down a notable 11.76% year-over-year. While this may seem like a correction, it also reflects a realignment of seller expectations after several months of aggressive pricing.
That said, the YTD average asking price is $976,000, still 7.46% higher than the same point in 2024
This shows sellers are still seeing substantial year-over-year equity gains—just not at the speculative pace seen earlier in the year.
Strathcona County -Acreage Sales
🏡 Sales Activity: Highest September Sales in Recent Years
In September 2025, 38 acreages were sold, representing a 22.58% increase over the same month last year. This uptick is significant given that fall usually signals a slowdown. Year-to-date, 330 acreages have sold, up 14.19% from 2024.
This signals two key trends:
- Buyers are continuing to pursue acreage life, especially as urban inventory tightens.
- Sellers are finding opportunities well beyond the traditional “spring market” cycle.
What It Means for Buyers:
Expect competition for move-in-ready homes, especially those with desirable features like workshops, treed privacy, and proximity to Sherwood Park or Hwy 21.
What It Means for Sellers:
Listings in the fall are getting serious attention. If your acreage is priced right and well-presented, you can still expect strong results before winter.
💰 Average Sale Price: A Minor Dip, But Long-Term Growth Holds
September's average sale price of $770,000 marked a slight 2.30% decline compared to September 2024. However, year-to-date, the average sits at $841,000, which is 11.27% higher than the same time last year.
Why the Drop?
- More mid-range acreages sold this month.
- Some higher-end properties may be holding until spring.
- Negotiation margins increased as DOM (days on market) grew.
Despite the dip, the year-to-date trend remains solid and shows strong long-term value appreciation for rural homes in Strathcona County.
📉 Ask-to-Sell Ratio: Small Gap, Smart Pricing Still Matters
September's ask-to-sell ratio was 0.969, meaning homes sold for 96.9% of their asking price. This is a modest improvement from last year’s 95.8%, showing buyers are still negotiating, but the market remains strong.
The year-to-date figure of 0.979 (97.9%) continues to reflect a high-confidence market, where well-priced homes are moving close to their list price.
Strathcona County Acreage Average Days on Market
⏱️ Days on Market: Longer Waits for Sale
In September, the average time on market was 95 days, an increase of 25% over the previous year. On a year-to-date basis, homes are still moving faster than in 2024 (72 vs 83 days) but this month indicates buyers are taking more time before committing
Key Factors:
- Slight seasonal slowdown heading into fall
- Higher price point properties sitting longer
- Buyer caution around rising interest rates
Sellers should prep for slightly longer listing timelines unless the home is priced sharply and marketed properly.
🧭 Year-to-Date Performance Snapshot
So far in 2025, rural Strathcona County has shown:
- 330 properties sold (up 14.19%)
- $841K average sale price (up 11.27%)
- 505 new listings (down 4.54%)
- Days on market reduced 13.25% YTD
This blend of fewer listings, faster sales (overall), and rising prices illustrates a market where demand outpaces supply, particularly for the right acreage properties.
💡 What Buyers Need to Know Right Now
If you’re shopping for a rural acreage in Strathcona County, the market is competitive, but it’s not out of reach.
Buyer Tips:
- Act fast on properties with upgraded features, great layouts, or unique land characteristics.
- Have financing prepped: A quick offer can be the difference-maker.
- Know your non-negotiables (e.g., treed lot, fencing, garage space).
- Work with a local REALTOR® who understands wells, septic systems, zoning, and more.
💼 What Sellers Should Do This Fall
Sellers are in a favourable position, especially if their home is priced within the mid-to-upper $700K to $900K range—where demand is strongest.
Seller Tips:
- List before winter to avoid slower holiday market conditions.
- Prep your property: clear driveways, stage interiors, showcase the yard before snow hits.
- Don’t overprice: Price it close to recent comps to avoid long DOM.
- Use aerial photos and acreage-specific marketing (drone, zoning maps, proximity to amenities).
🧠 Investor Insights: Still Room for Smart Acreage Plays
While the price gains are tapering slightly, the 11.27% YTD price increase suggests strong fundamentals. For investors, rural Strathcona County remains a smart place to:
- Buy and hold appreciating land
- Invest in live-in fixer-uppers
- Purchase income-generating acreages with rental suites, shops, or agricultural income potential
🔮 Looking Ahead: What to Expect in Q4
As we enter Q4:
- Expect fewer new listings
- Buyers may get more negotiating power on homes that have sat longer
- Well-priced homes will continue to move
- Watch for interest rate changes that may influence financing conditions
Sellers should act now to take advantage of fall activity. Buyers should be ready to pounce on good opportunities before the winter lull.
📞 Ready to Buy or Sell? Let’s Connect.
Whether you’re planning to list your acreage before winter or are looking for a quiet property with mature trees and room to grow—let’s chat about your options in rural Strathcona County.
Christina Reid, REALTOR® – Century 21 Leading
📞 (780) 717-5267
📧 creid@chrisreidedmonton.com
🌐 www.chrisreidedmonton.com
Data provided by the REALTORS® Association of Edmonton and subject to change. Always consult with a real estate professional for the most current market information.
Looking to Buy or Sell Acreages in Strathcona County?
Whether you're a buyer eager to find your perfect rural retreat or a seller ready to capitalize on this favourable market, I’m here to help. Reach out to explore available properties or to discuss your goals.
CENTURY 21 Leading
INFO & SERVICES
CENTURY 21 Leading
14315 118 Ave NW, Unit 130, Edmonton, AB T5L4S6
(780) 455-0777
INFO & SERVICES

Independently Owned and Operated. ®/™ trademarks owned by Century 21 Real Estate LLC used under license or authorized sub-license. © 2020 Century 21 Canada Limited Partnership © 2020 Century 21 Canada Limited Partnership
The trademarks MLS®, Multiple Listing Service® and the associated logos identify professional services rendered by REALTOR® members of CREA to effect the purchase, sale and lease of real estate as part of a cooperative selling system. The trademarks REALTOR ® , REALTORS ® and the REALTOR ® logo are controlled by The Canadian Real Estate Association (CREA) and identify real estate professionals who are members of CREA. Used under license. This listing content provided by REALTOR.ca has been licensed by REALTOR® members of The Canadian Real Estate Association. Not intended to solicit properties currently listed for sale or buyers under contract.
Century 21 Canada Limited Partnership currently has franchise opportunities available in select markets across Canada. The intent of this communication is for informational purposes only and is not intended to be a solicitation to anyone under contract with another real estate brokerage operation. This e-mail message contains confidential information intended only for the use of the individual or entity named above. Any unauthorized use or disclosure is strictly prohibited. If you have received this communication in error please immediately delete the e-mail and either notify the sender at the above e-mail address or by telephone.
© 2026 MoxiWorks
